Project - ML Model Deployment
Table of Contents
Embarking on the journey of machine learning and data analysis, the question arises: what comes next? How can we transform our built models or analytical outcomes into practical applications? This blog post explores the creation of a machine learning system, drawing upon data from the manufacturing sector in the Tianchi Big Data Competition. It encompasses model construction, API service deployment, system monitoring, and employs a CI/CD tool for process automation.
Data Source
This project deals with chemical continuous process data, aiming to predict Yield – a regression challenge. Data is sourced from AWS S3.
Digital Manufacturing Algorithm Competition of JinNan Tianjin
Model Deployment
The actual machine learning code often forms a minor part of the overall system, with the bulk involving data handling, feature engineering, deployment, and monitoring.
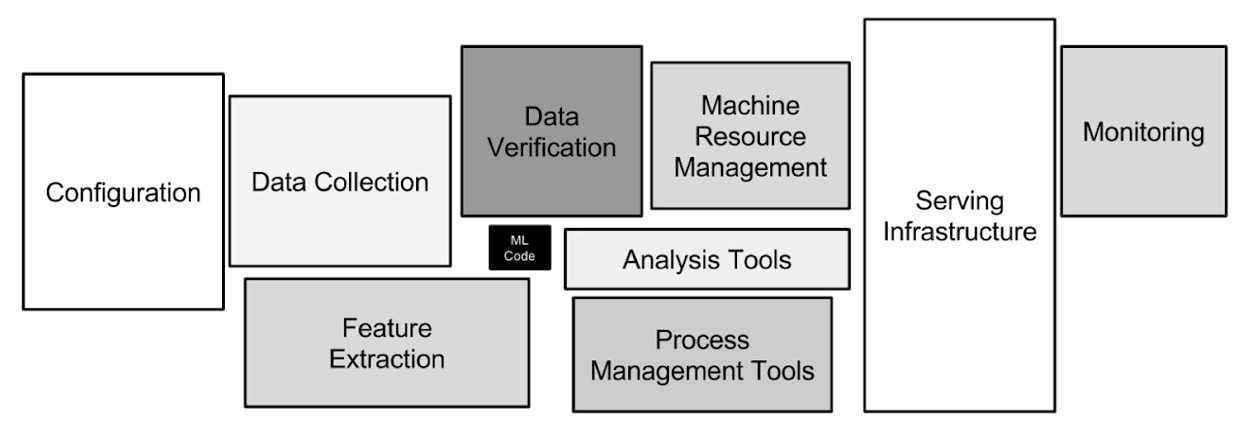 Source: Hidden Technical Debt in Machine Learning Systems(2015)
The machine learning modelling process includes data validation, feature engineering, model training, and deployment. A unique aspect of ML systems is their extensive reliance on Data + Models compared to traditional IT systems, posing challenges in regulating system behaviour. A critical factor is “Reproducibility,” ensuring consistent outputs from identical inputs. This necessity underscores the importance of system testing to minimise unexpected behaviour (Uncertainty).
To achieve “Reproducibility,” consider the following:
- Employ version control for tracking code and data modifications.
- Use fixed seeds for processes involving randomness.
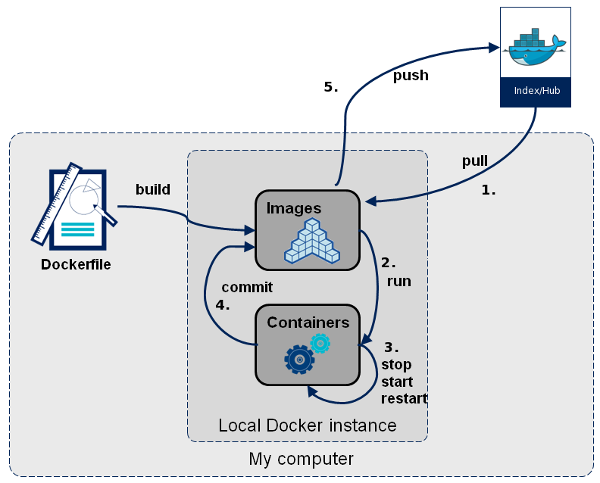
- Utilise containerisation, such as Docker, for consistent application performance across different environments.
End-to-End ML System
The below diagram illustrates the iterative process of constructing an end-to-end ML system.
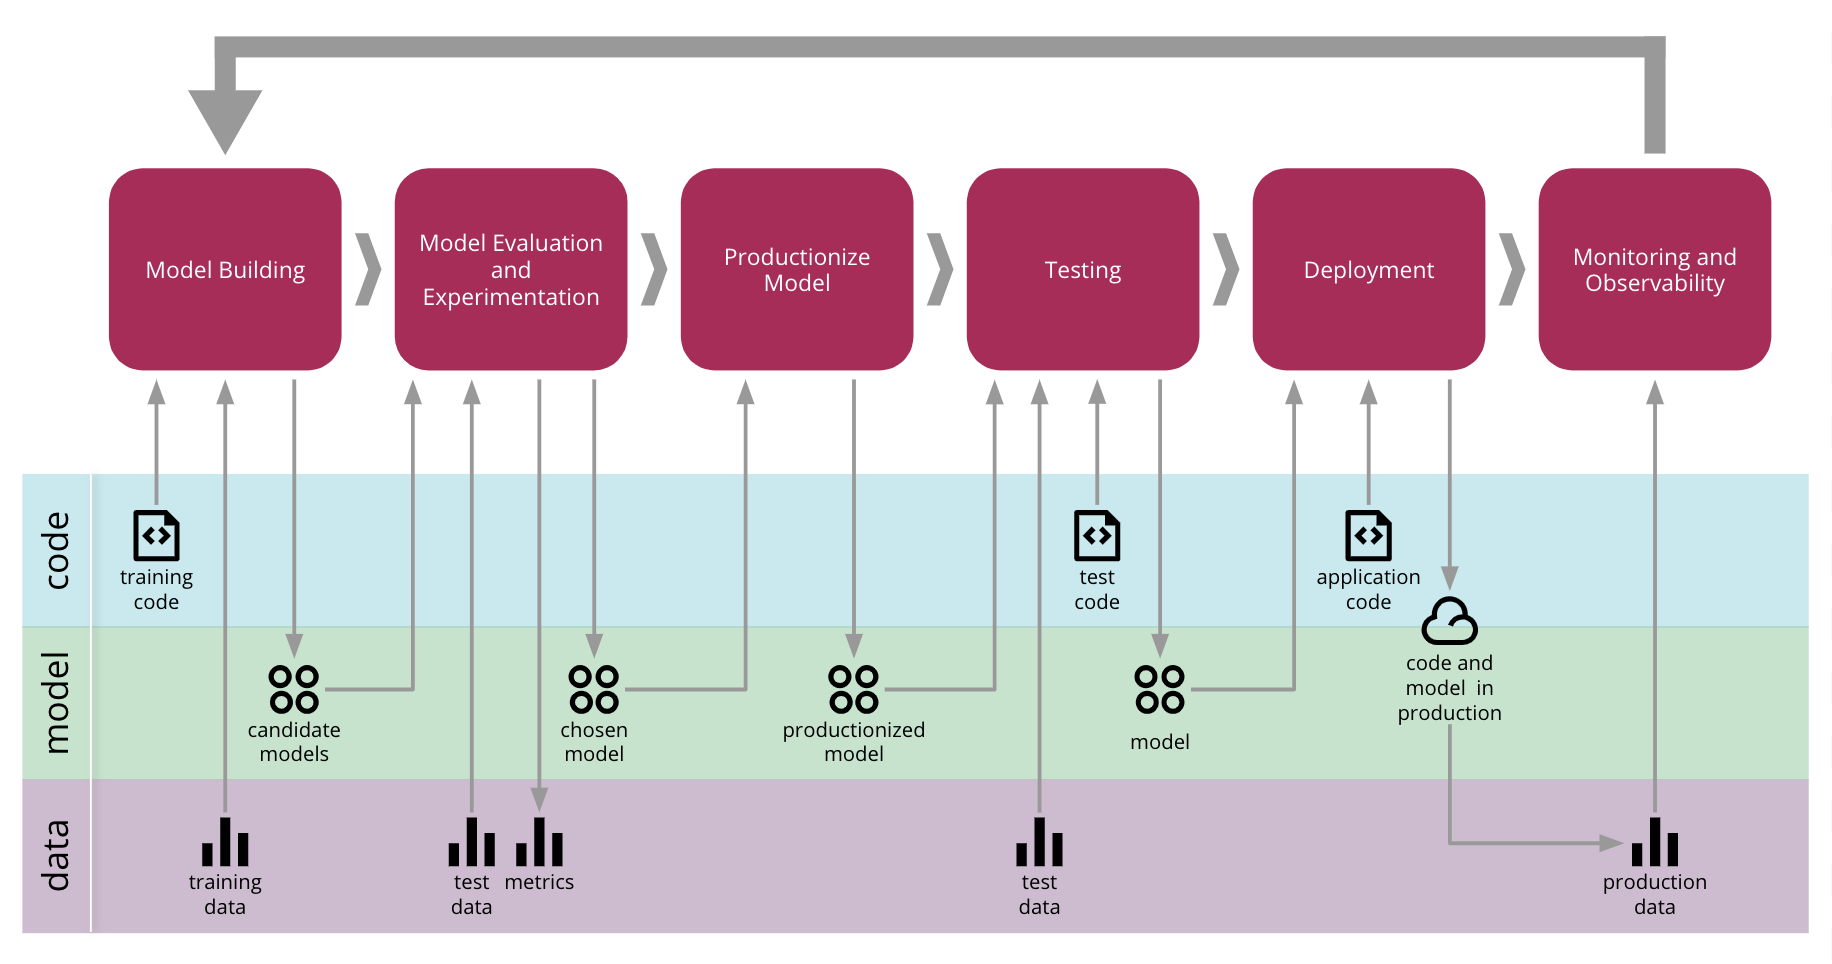 Source: Continuous Delivery for Machine Learning
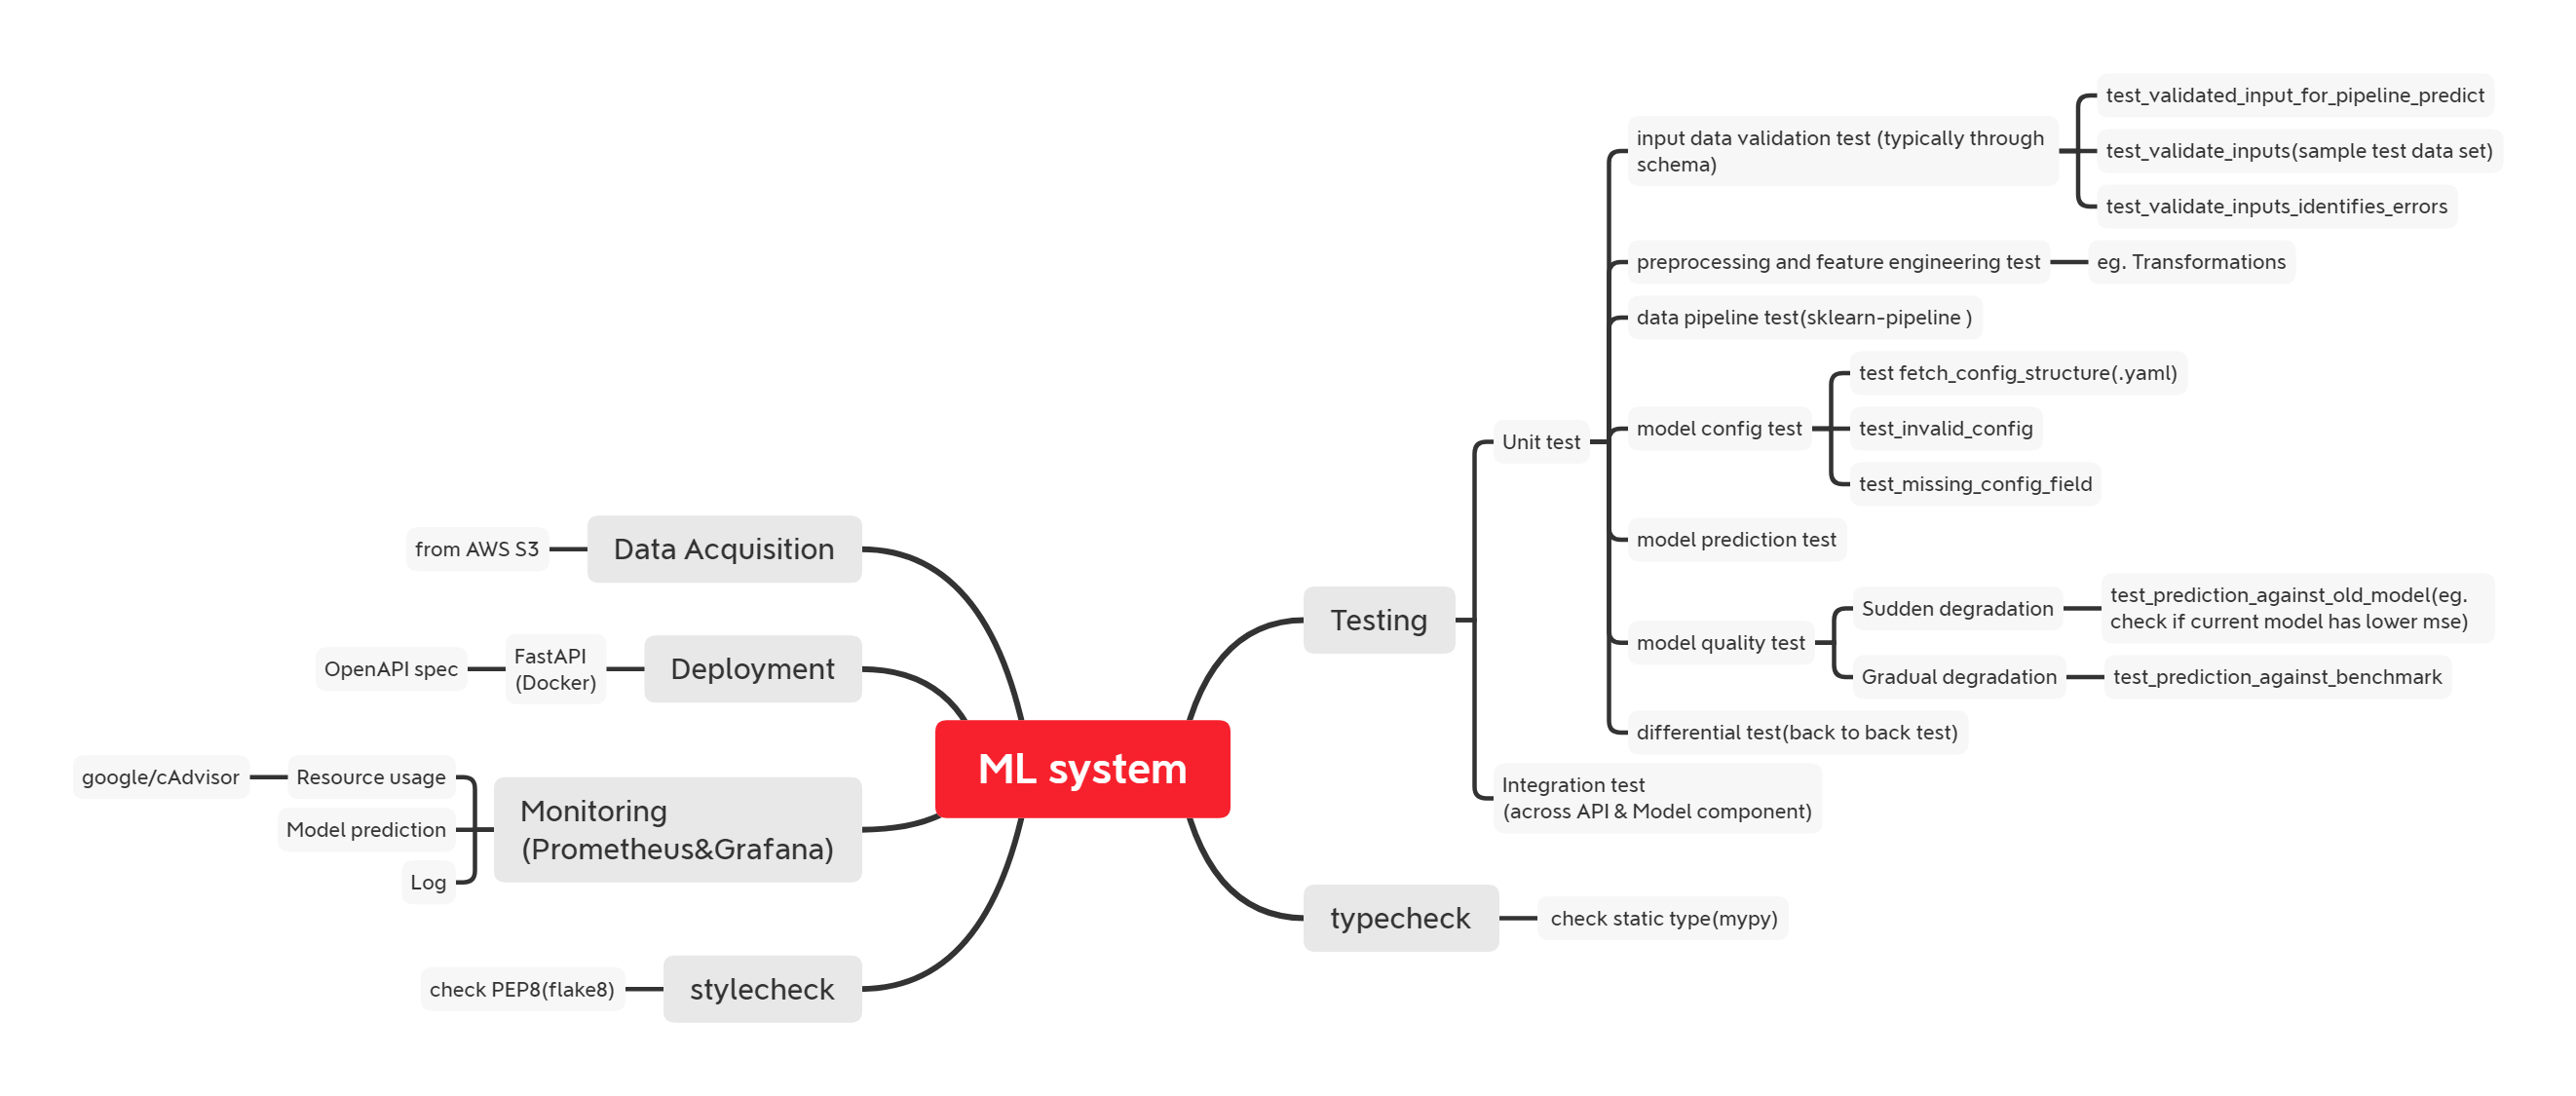
This project adopts the following architecture:
Productionising the Model
Deployment involves packaging the entire pipeline, from data processing to model deployment, into a cohesive unit. We utilise sklearn.pipeline for bundling steps like feature engineering and model training. The trained model and associated configurations are then packaged and pushed to a private Package Repository on gemfury.
Deployment via API
For deployment, we utilise the FastAPI framework, supporting Python 3.6+, known for its automatic generation of OpenAPI specs and schema validation using Pydantic.
 Source: tiangolo/fastapi
Containerisation through Docker facilitates the simultaneous launch of multiple services (MLAPI, Prometheus, Grafana, cAdvisor) using docker-compose.
Why Docker for ML?
- Reproducibility: Ensures consistent model performance.
- Scalability: Broad support across major cloud platforms.
- Isolation: Guarantees independent operation and resource management.
- Maintainability: Simplifies environment setup and enhances team collaboration.
 Source: SUPERCHARGE YOUR DEVELOPMENT ENVIRONMENT (USING DOCKER)
Deploy to Cloud
Deploying applications on the cloud is a versatile way to provide services. We have the choice between Platform as a Service (PaaS) and Infrastructure as a Service (IaaS). In this project, we opted for Heroku and AWS. The key difference lies in the degree of control: IaaS offers more flexibility and requires managing more components, whereas PaaS simplifies deployment.
Cloud Deployment Options
-
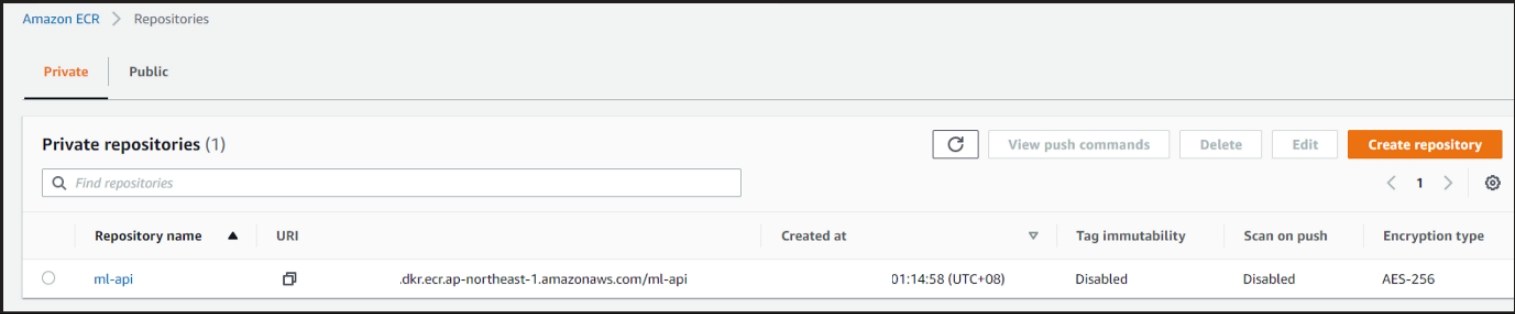
Elastic Container Registry (ECR): A vital AWS service where Docker images are stored, making them accessible to other AWS services.
-
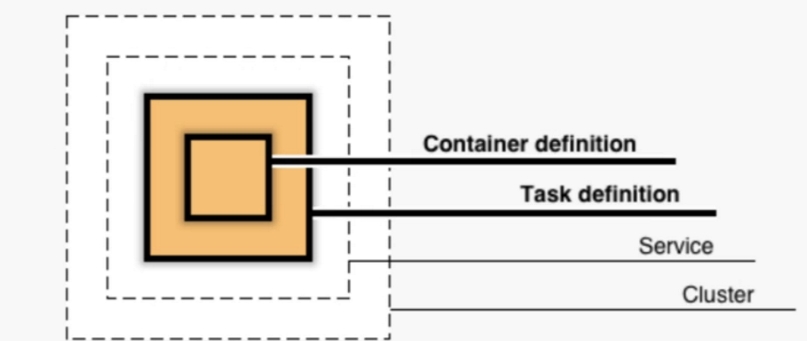
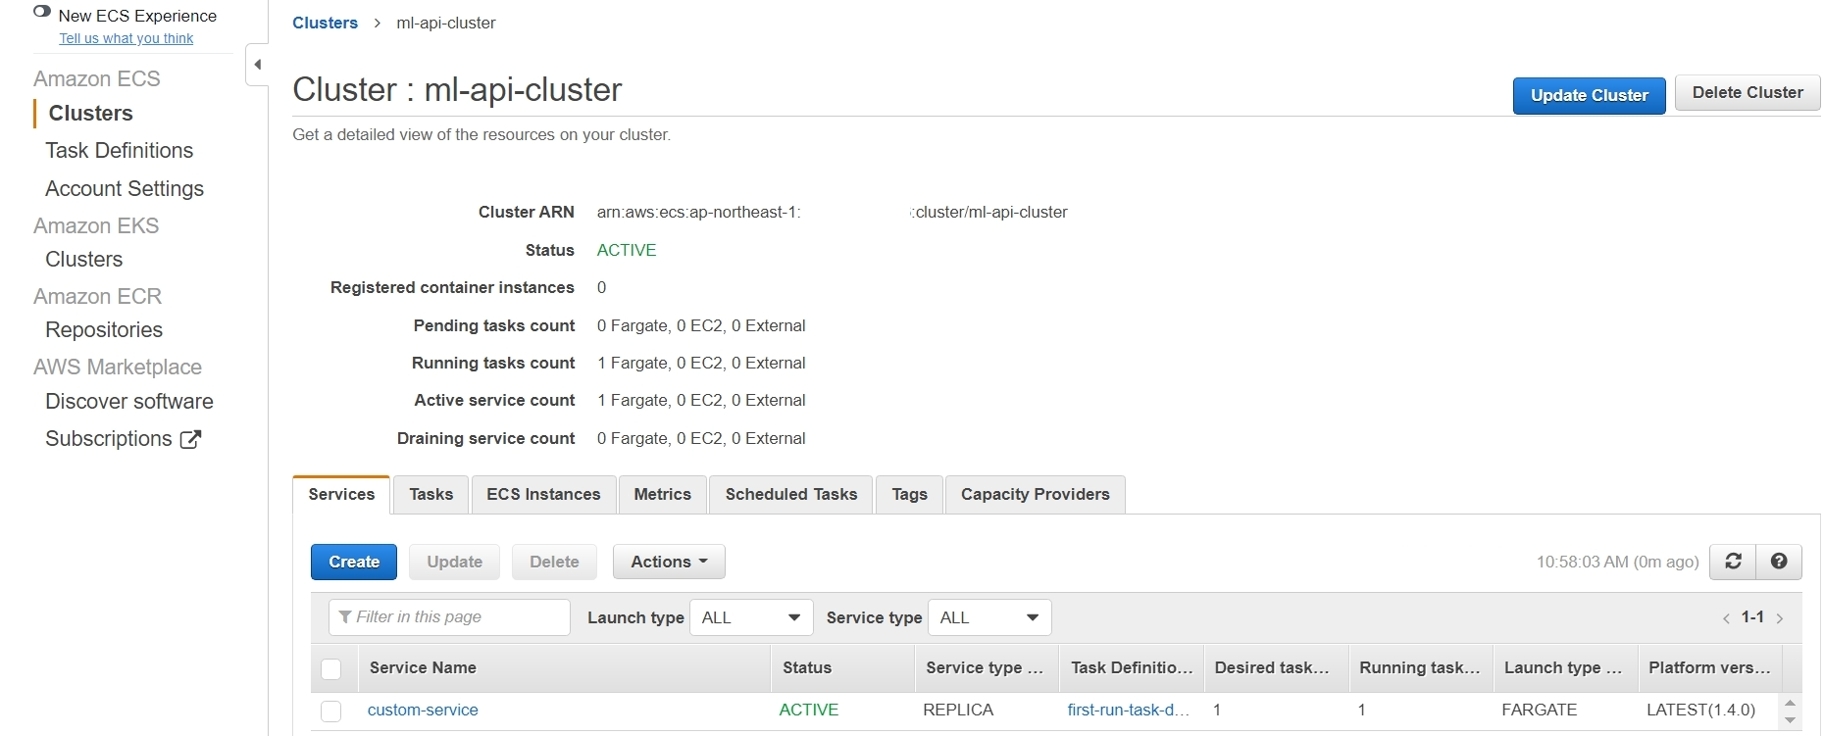
Amazon Elastic Container Service (ECS): Manages Docker containers efficiently. The architecture necessitates setting up a cluster first, followed by defining internal services and tasks.
 Source: AWS
For example, in our project, a cluster named “custom-service” was established.
Monitoring
Effective monitoring is achieved using Prometheus and Grafana. Prometheus architecture involves periodic retrieval and storage of time-series data via HTTP pull method. It supports the PromQL language for data querying and visualisation in Grafana, and also enables setting alerts for anomalies.
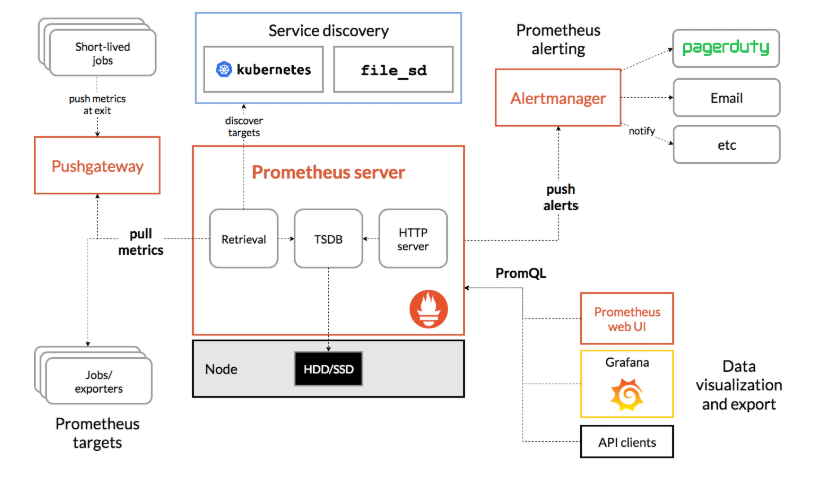 Source: Prometheus
Aspects of Monitoring
-
Docker Monitoring: Monitors Docker system resources using google/cAdvisor.
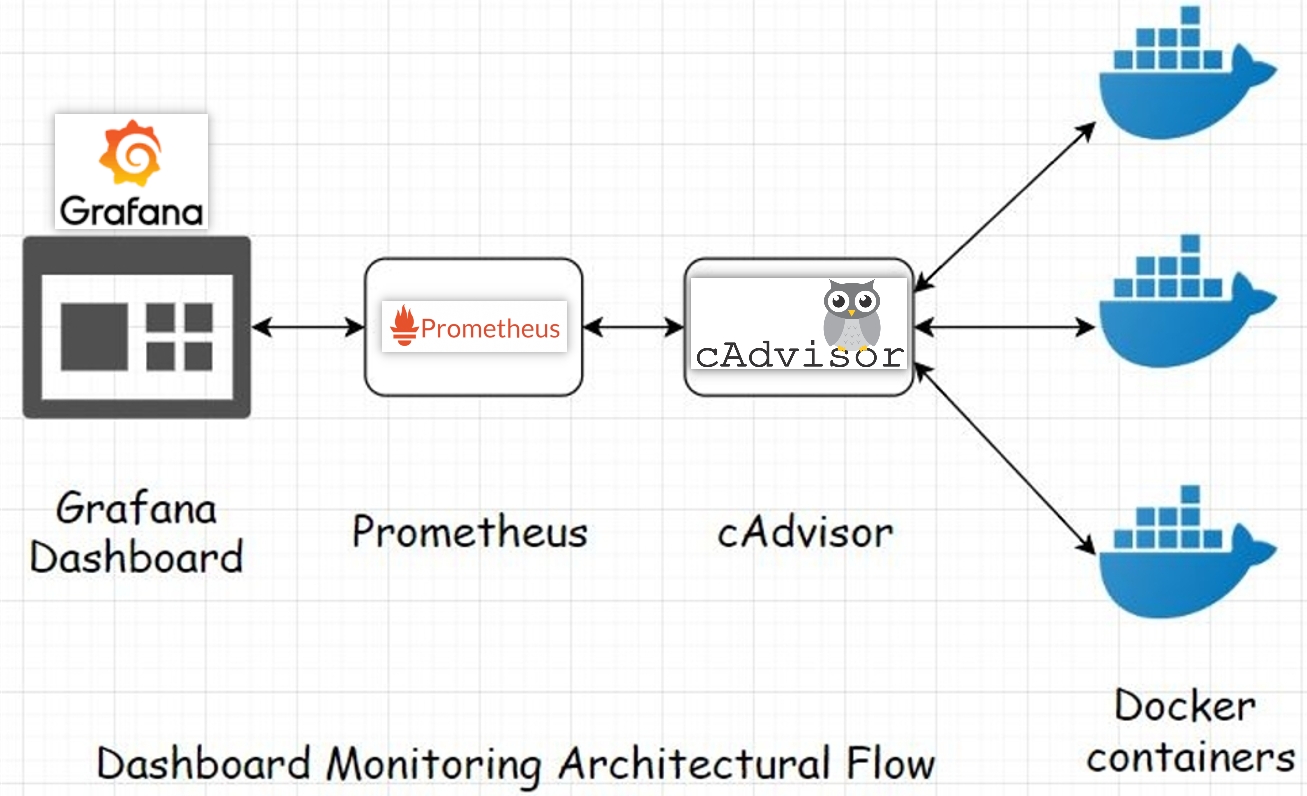 Source: 8bitmen.com
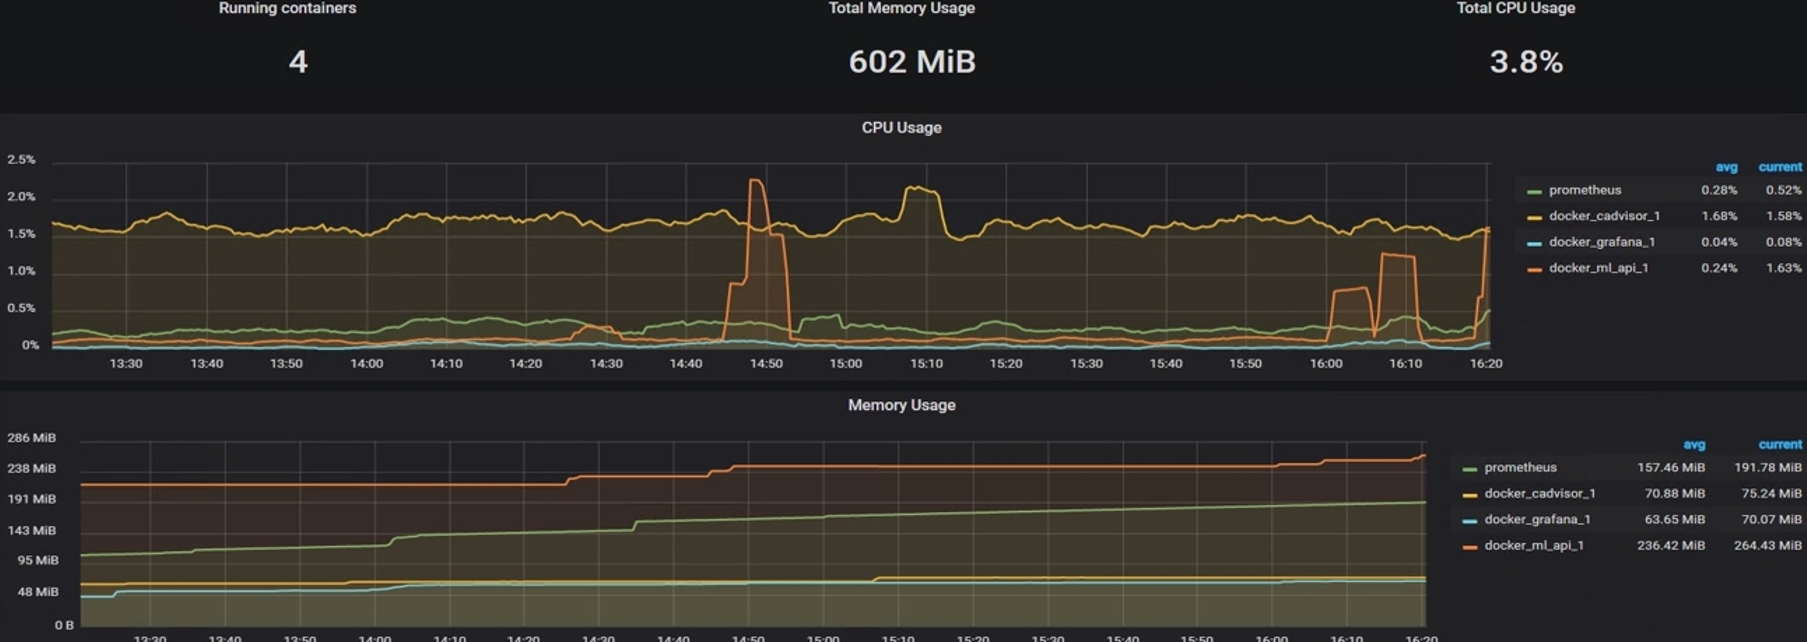
Monitoring includes CPU and memory usage of services, as shown below.
-
Model Monitoring: Focuses on the predicted values of the model, including the frequency and consistency of predictions over time, and uses statistical methods for analysis.
-
Log Monitoring: Utilises the ELK Stack for monitoring textual data. Kibana is preferred over Grafana for text-based data due to performance considerations in time-series databases.
Monitoring input data for drift is also a critical part of ensuring model accuracy.
Continuous Integration/Continuous Deployment (CI/CD)
The goal is to automate all stages of application development, testing, and deployment. This makes the system consistently ready for release, standardises processes, and enhances transparency and traceability. In this project, CircleCI is the tool of choice.
 Source:CircleCI
The process begins with a “config.yml” file defining the jobs and steps. CircleCI’s integration with GitHub facilitates automated triggers for jobs upon new pull requests or commits.
Below is an example of the deployment process, initiated once the test_app (unit and integration tests for mlapi) passes. The model package is uploaded and released upon merging into the main branch and tagging the commit.
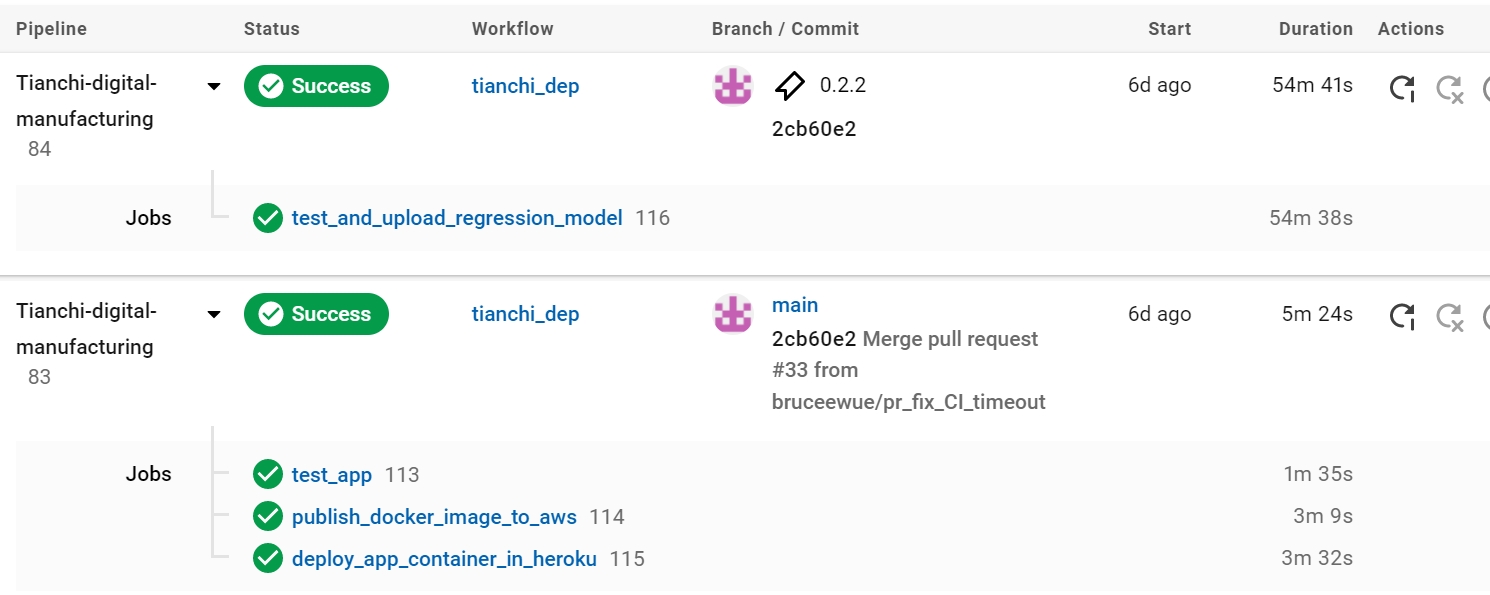
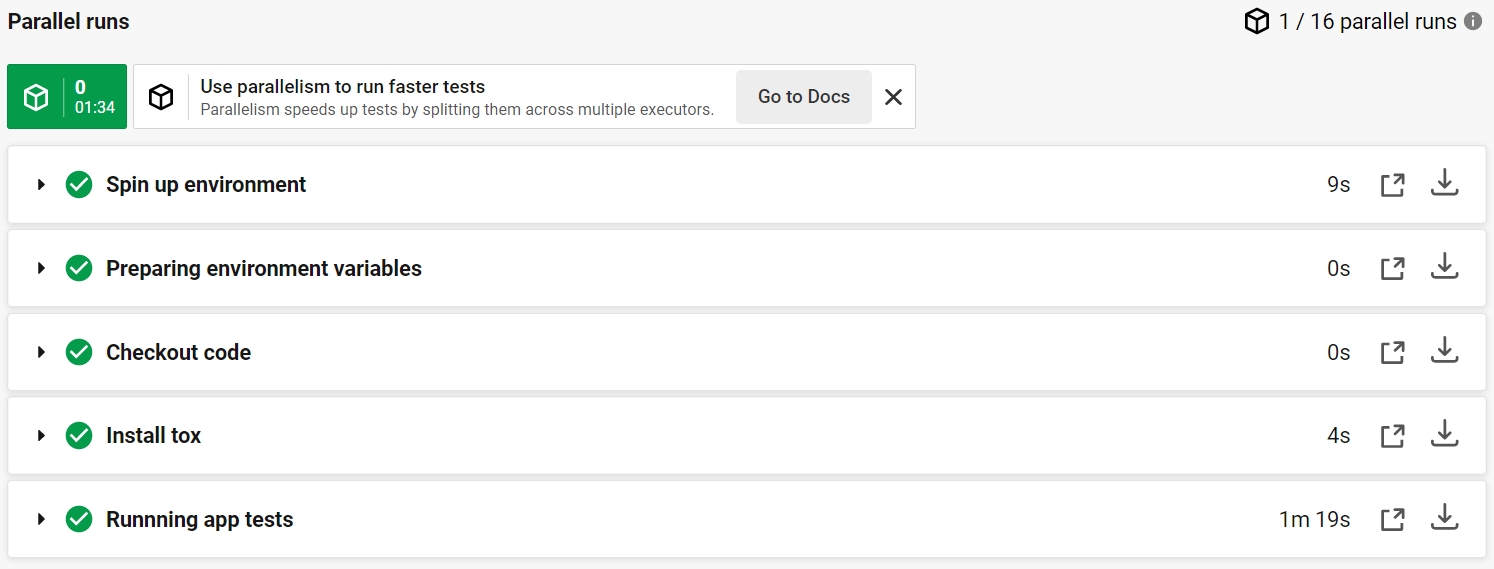
An example of the “test_app” job showcasing the use of Tox, an automated testing tool integrated with Pytest.
Additional Resources
- Deployment of Machine Learning Models - Online Course
- Testing and Monitoring Machine Learning Model Deployments - Online Course