Project - London Cycling Analytics
Table of Contents
- The Essence of TFL’s Cycling Data
- The Architectural Blueprint
- The Dashboard: A Window to Cycling Trends
- Setting the Stage: Pipeline Implementation
To optimize the provided blog content on “London’s TFL cycling data pipeline”, I suggest several enhancements for SEO and reader engagement. Here’s the revised blog in Markdown format:
London’s TFL Cycling Data Pipeline: A Comprehensive Data Engineering Project
Understanding urban cycling trends is crucial for developing efficient and sustainable city transportation systems. In this blog, we delve into a cutting-edge data engineering project that utilizes London’s Transport for London (TfL) cycling data to unravel the intricacies of cycling patterns in this bustling metropolis.
Data Set: A Closer Look
The data, sourced from TfL’s Cycling Data, comprises comprehensive CSV-formatted records. Here’s a snapshot of the data structure:
| Column Name | Description |
|---|---|
| Rental Id | A distinct identifier for each ride |
| Duration | The length of time the ride lasts |
| Bike Id | A distinct identifier for the bicycle |
| End Date | The time at which the ride ended |
| EndStation Id | A distinct identifier for the destination station |
| EndStation Name | The name of the station where the ride ends |
| Start Date | The time at which the ride started |
| StartStation Id | A distinct identifier for the origin station |
| StartStation Name | The name of the station where the ride begins |
Pipeline Overview: Integrating Advanced Tools and Technologies
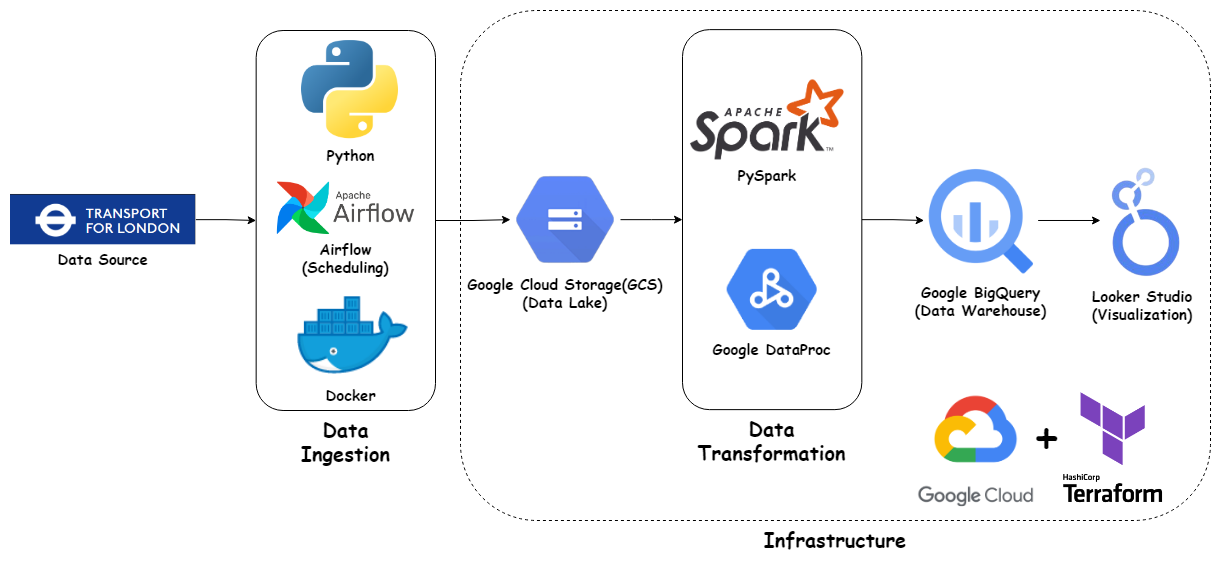
Our project harnesses a plethora of sophisticated tools and technologies to forge a robust end-to-end data engineering pipeline:
- Google Cloud Platform (GCP): The backbone for data storage, processing, and analytics.
- Google Cloud Storage (GCS): Our data lake for raw and processed datasets.
- Google Cloud Dataproc: A powerhouse for fast data processing via Apache Spark and Hadoop.
- BigQuery: A serverless, scalable data warehouse tailor-made for analytics.
- Terraform: Orchestrating GCP resources with Infrastructure as Code (IaC).
- Apache Airflow: The conductor for our data pipelines.
- PySpark: Python’s gift to big data processing with Apache Spark.
- Looker Studio: Where data transforms into interactive visual stories.
The Pipeline in Action: Steps for Streamlined Data Processing
a. Data Ingestion:
- Implementation of Apache Airflow for scheduling and automating data ingestion.
- Conversion of CSV files to Parquet format for efficiency, stored in GCS.

b. Data Transformation:
- Utilization of PySpark and Google Cloud Dataproc for cleaning, filtering, and aggregating data.
c. Data Storage:
- Leveraging Google BigQuery for storing transformed data, enabling real-time analytics.
d. Data Visualization:
- Employing Looker Studio for crafting interactive dashboards, providing profound insights into London’s cycling trends.
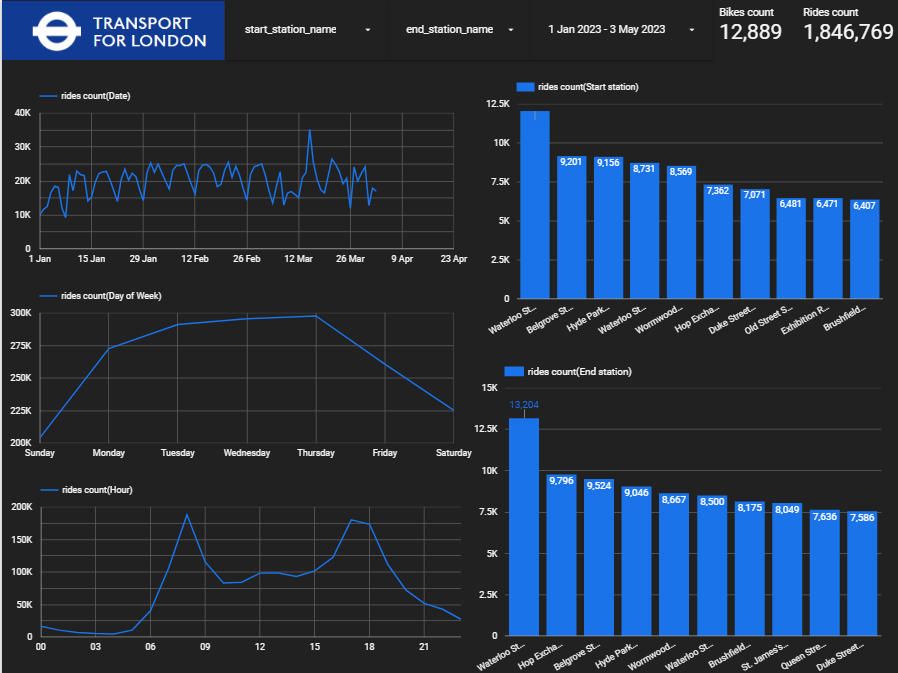
Interactive Dashboard: Visualizing Insights
A comprehensive dashboard, designed in Looker Studio, brings data-driven narratives to life, aiding stakeholders in informed decision-making.
Setting Up the Pipeline: Your Step-by-Step Guide
-
Repository Cloning:
Start by cloning the GitHub repository:
git clone https://github.com/bruceewue/de_zoomcamp_tfl_cycling.git -
Google Cloud Platform Setup:
Create a new project and authenticate your account with the Google Cloud SDK. -
Terraform Initialization:
Install Terraform and initialize the configuration to set up GCP resources.terraform init terraform plan terraform apply -
Apache Airflow Configuration:
Customize your docker-compose.yml with GCP Project ID and GCS bucket information.Next, open your web browser and navigate to the Airflow web server URL: http://localhost:8080, and manually trigger a task run, click the play button located next to the DAG name Once your DAG runs successfully, you will see that the Parquet files have been stored in your data lake, which is located in Google Cloud Storage (GCS).
-
PySpark & Dataproc Activation:
Enable the Dataproc API, create a cluster, and execute PySpark jobs for data transformation.cd spark # Upload PySpark file to GCS gsutil cp spark_sql_big_query.py gs://GCP_GCS_BUCKET/code/spark_sql_big_query.py # Submit a PySpark job gcloud dataproc jobs submit pyspark\ --cluster=YOUR_CLUSTER \ --region=europe-west1 --jars=gs://spark-lib/bigquery/spark-bigquery-latest_2.12.jar gs://cycling_data_lake_cycling-uk/code/spark_sql_big_query.py \ -- \ --input=gs://GCP_GCS_BUCKET/raw/\ --output=YOUR_BIGQUERY_TABLE
Once the PySpark job is completed successfully, the transformed data will be stored in the specified BigQuery table.