Project - Job Scraping and Analysis

Table of Contents
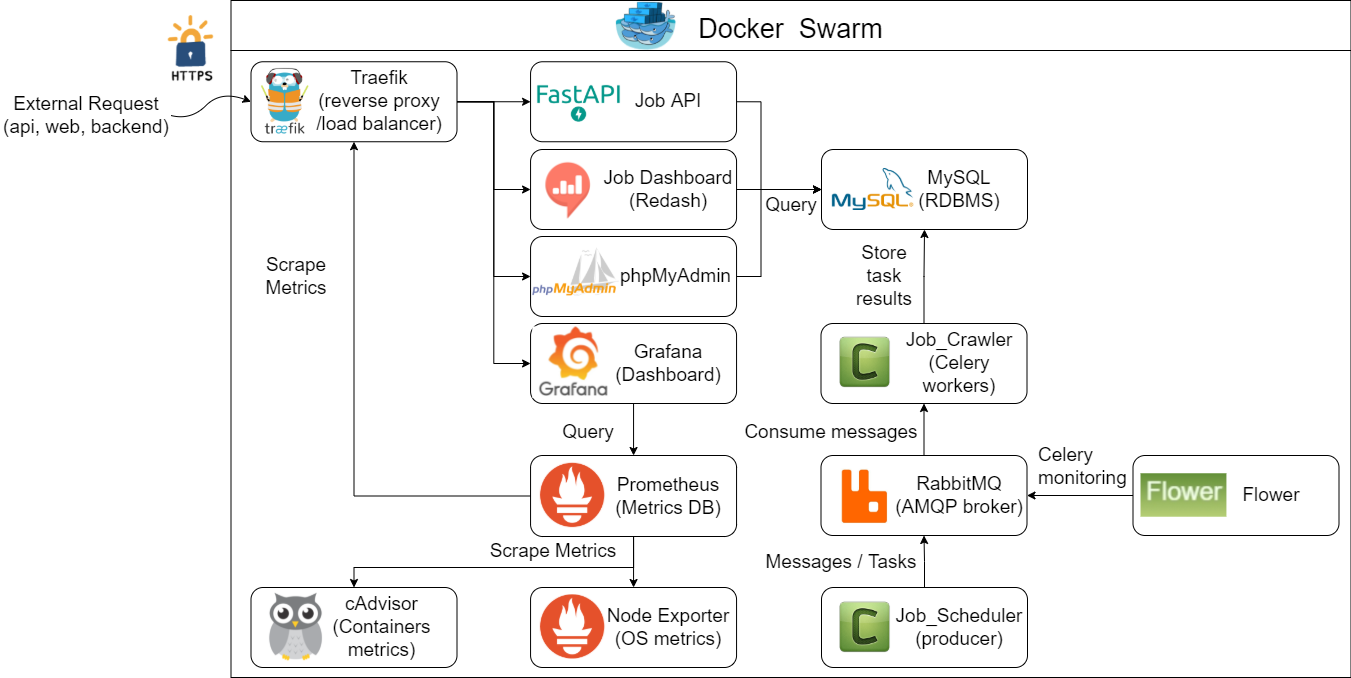
Project Diagram
Environment
Development: Ubuntu 20.04 (WSL2) + Python 3.9
Deployment: VM (2 OCPUs (ARM64), 12GB RAM) x 2 on Oracle Cloud
Data Source

Indeed job search:

Source: Indeed
I have selected Indeed, the UK’s premier job search platform, as the data source. The focus is on full-time, data science-related positions in the London area to minimise server load. Only recent listings are collected, with new posts automatically crawled daily. The system is designed for future expansion to include other platforms and job types.
Why Distributed?
- Enhanced crawler efficiency.
- Single-machine limitations and failure risks when scaling up.
- Prevention of IP blocking from excessive crawling, mitigated with programmed sleep intervals.
Celery/RabbitMQ/Flower
Celery excels as a distributed system, offering simplicity, flexibility, and reliability for processing large volumes of messages. It’s particularly effective for real-time task processing and scheduling, providing essential tools for operational management.
In a distributed crawling architecture, three key roles are integral:
- Producer: Responsible for dispatching tasks to the Broker.
- Message Broker (RabbitMQ in this context): Receives tasks and forwards them to Workers.
- Worker: Executes tasks received from the Broker, such as Crawlers.
The process flow is straightforward: The producer sends tasks to the queue. Workers, connected to the broker and acting as task executors, then retrieve and process these tasks according to predefined settings.
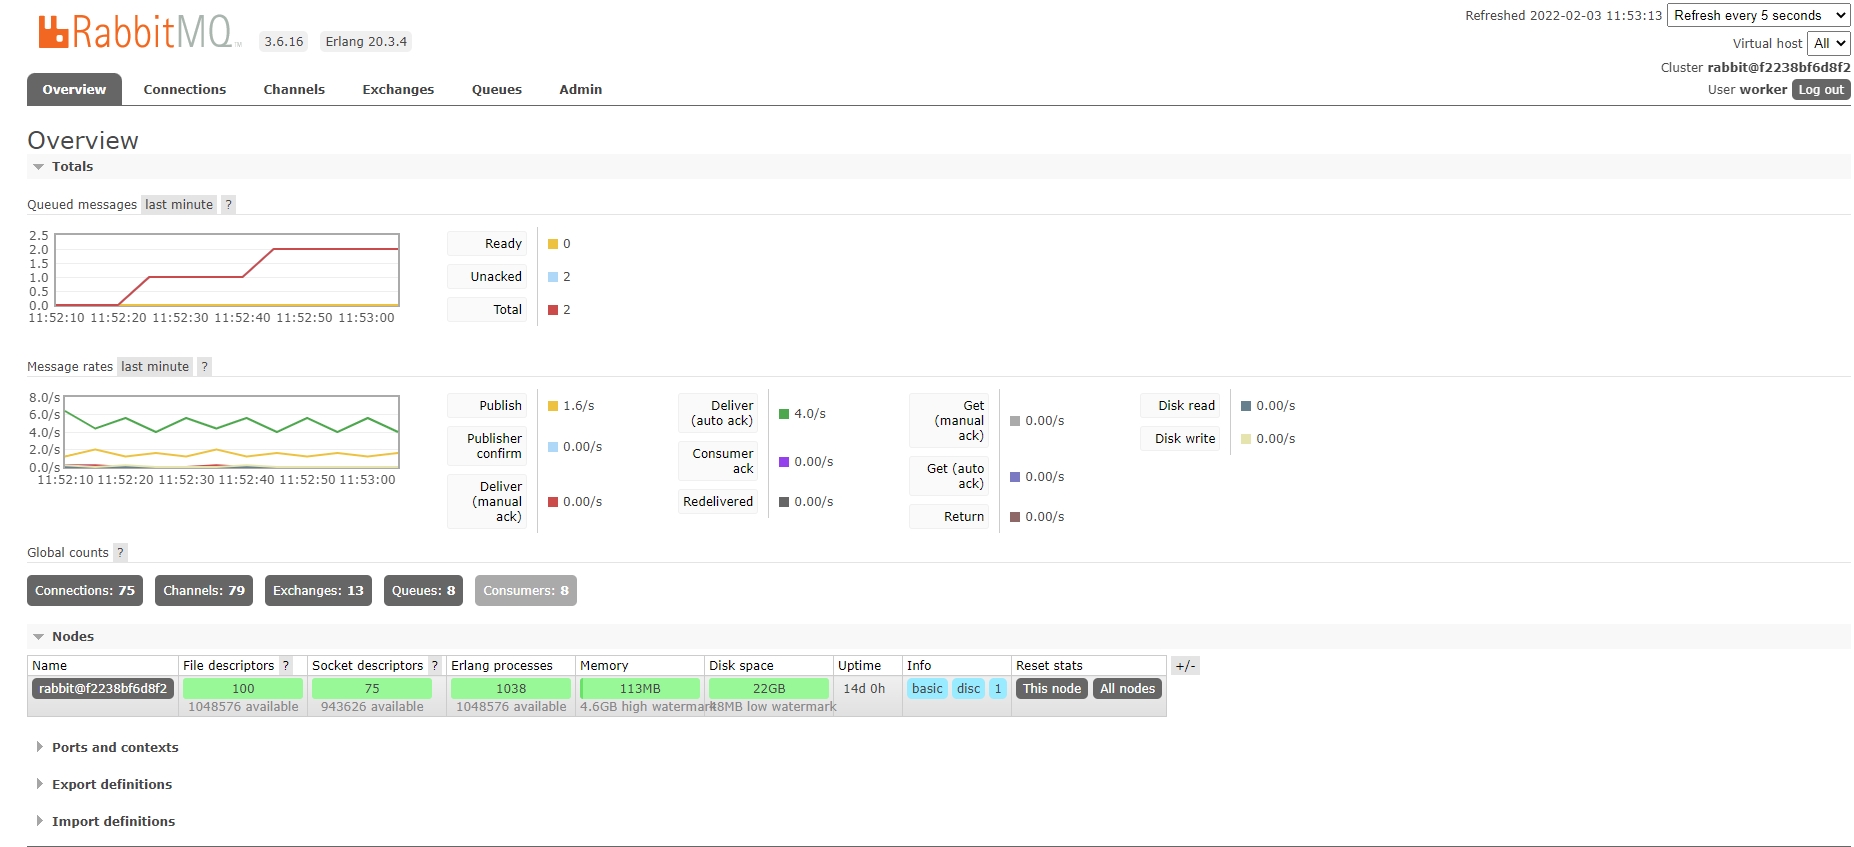
Below is an overview of RabbitMQ, showcasing two tasks awaiting processing in the queue. The ‘queue’ page provides further insights into each queue’s status and detailed information about the tasks.
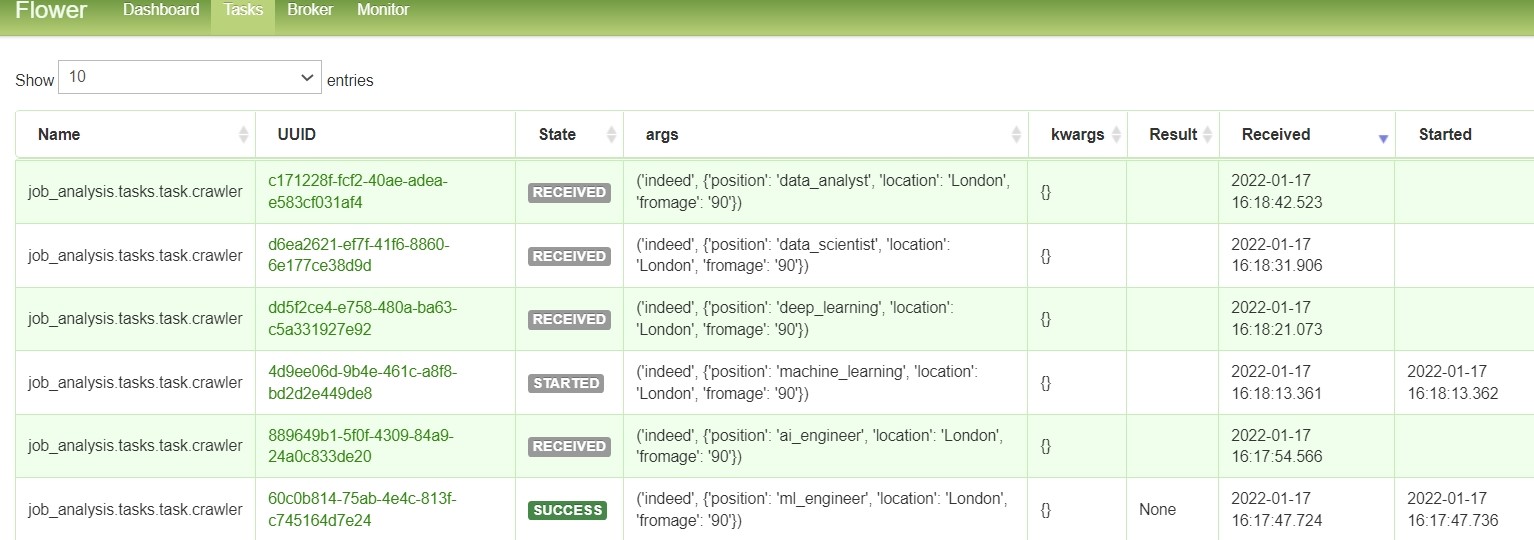
Worker monitoring is efficiently handled by Flower. It allows us to check whether the workers are active and assess the status of task execution. In this project, we’ve currently enabled two workers, a number that can be adjusted based on project requirements.
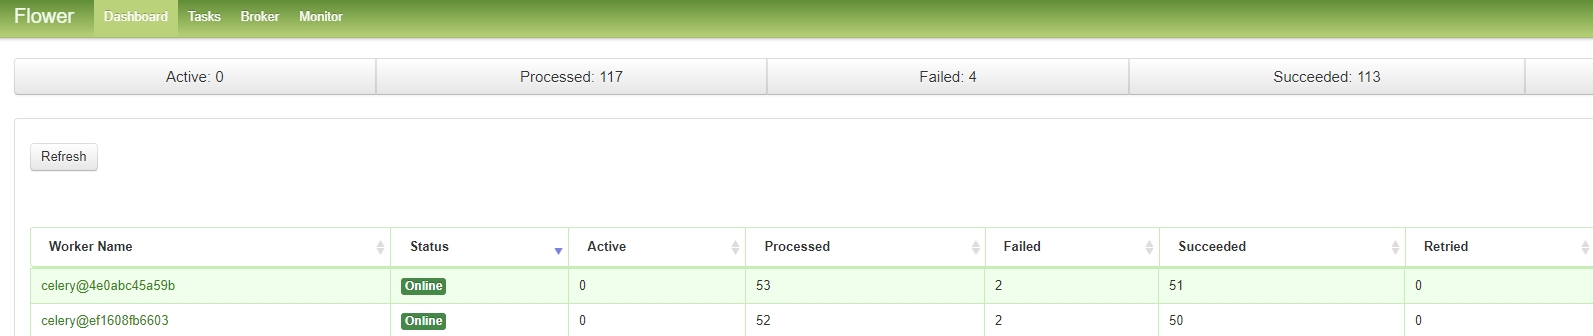
Additionally, Flower provides a comprehensive list of tasks executed by the workers, enhancing the transparency of the workflow.
Scheduling
To crawl new job vacancies daily, the Python package APScheduler schedules the function ‘sent_crawler_task_DE’ to run every day at 12:00 Taipei time.
scheduler = BackgroundScheduler(timezone="Asia/Taipei")
scheduler.add_job(
    id="sent_crawler_task_DE",
    func=sent_crawler_task_DE,
    trigger="cron",
    hour="12",
    minute="0",
    day_of_week="*",
)
API & Load Test
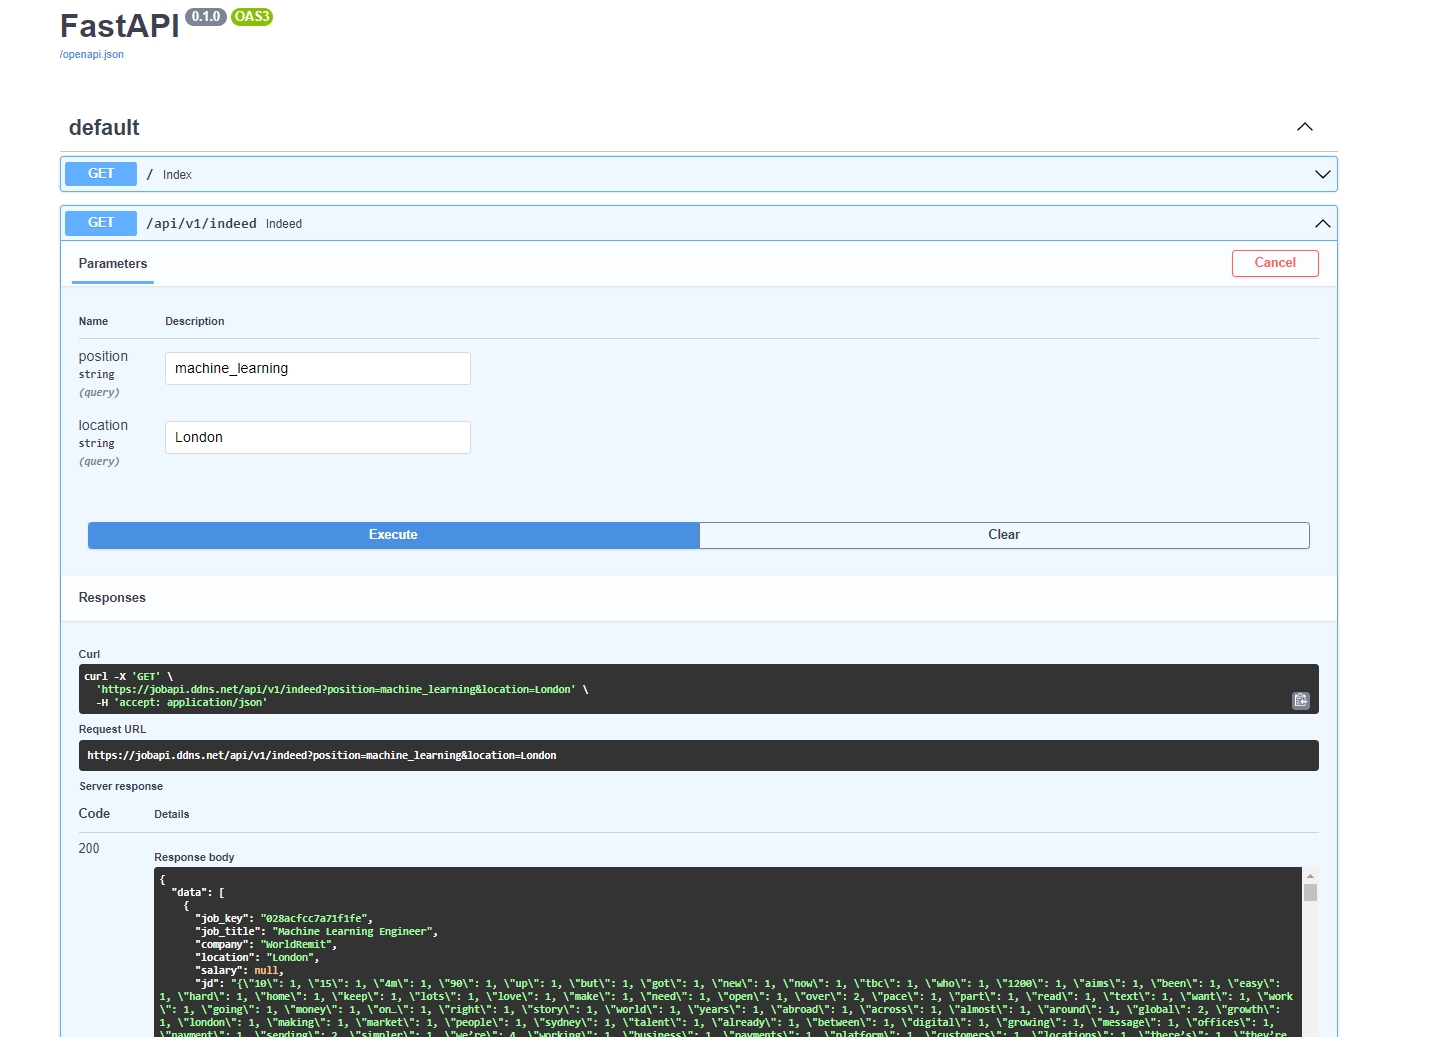
FastAPI stands out for creating RESTful APIs, with the added benefit of auto-generating OpenAPI documentation (OAS3). This feature simplifies the testing of APIs directly via a web interface.
Upon specifying the job position and location parameters, the API adeptly returns the relevant job vacancy data in JSON format, showcasing the power of FastAPI in handling dynamic data queries.
To ensure the API’s robustness, conducting load testing is a crucial step. ApacheBench (ab), a Python package, is an excellent tool for this purpose. It emulates a scenario where multiple users send concurrent requests to the server, thus testing its capacity to handle heavy traffic.
The command below demonstrates how to perform load testing on a locally deployed API service, with a concurrency level of 10 and a total of 1000 requests:
apt-get install apache2-utils -y
ab -c 10 -n 1000 'http://127.0.0.1:8888/'
The resulting output provides valuable insights:
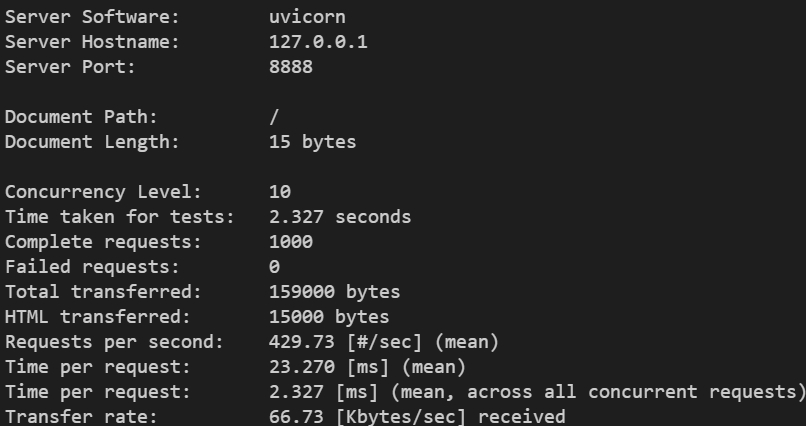
- Requests per second: Indicates how many requests the API can process each second.
- Time per request: Represents the average response time for each request, measured in milliseconds.
- Failed requests: The count of requests that didn’t succeed, offering clues about the server’s stability.
This load testing phase is integral in evaluating the performance and reliability of the API under simulated high-traffic conditions.
Dashboard
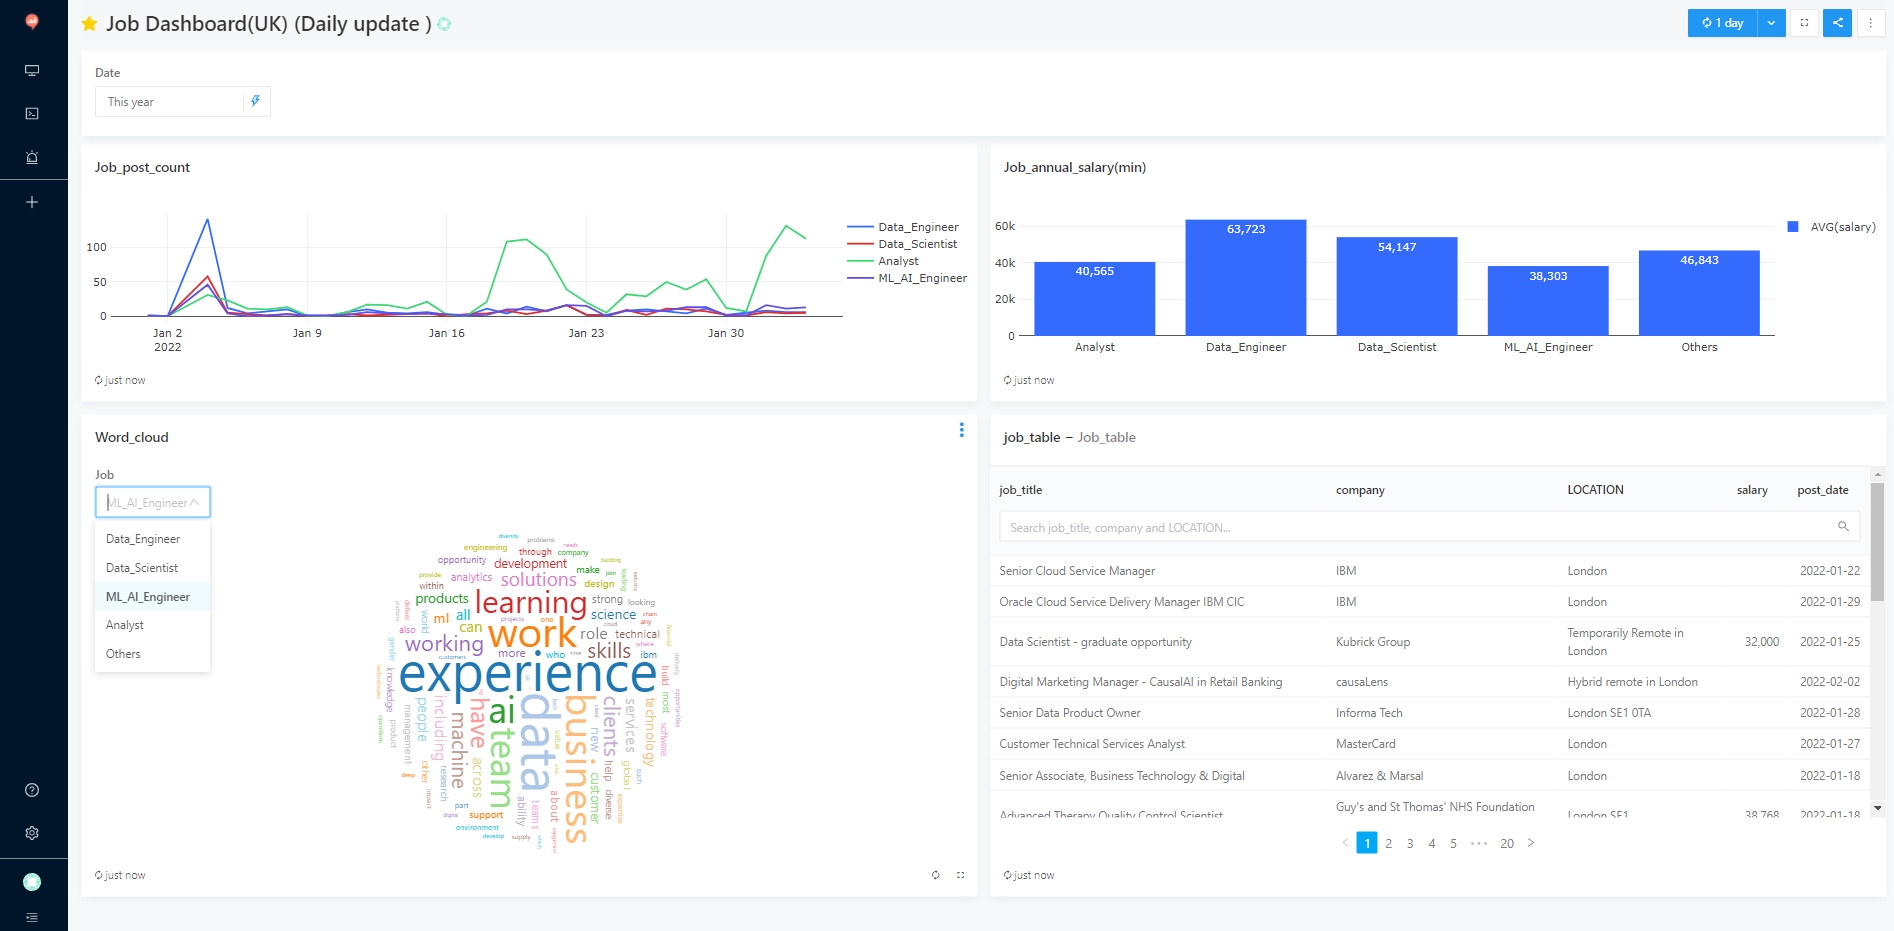
A comprehensive dashboard is created using Redash, enabling easy data retrieval and visualisation. The advantage is that it is convenient to retrieve data from the DB through SQL query, and then visualize the results (currently supporting Chart, tunnel, map, pivot table, word cloud, etc.). The results are as follows.
Deployment
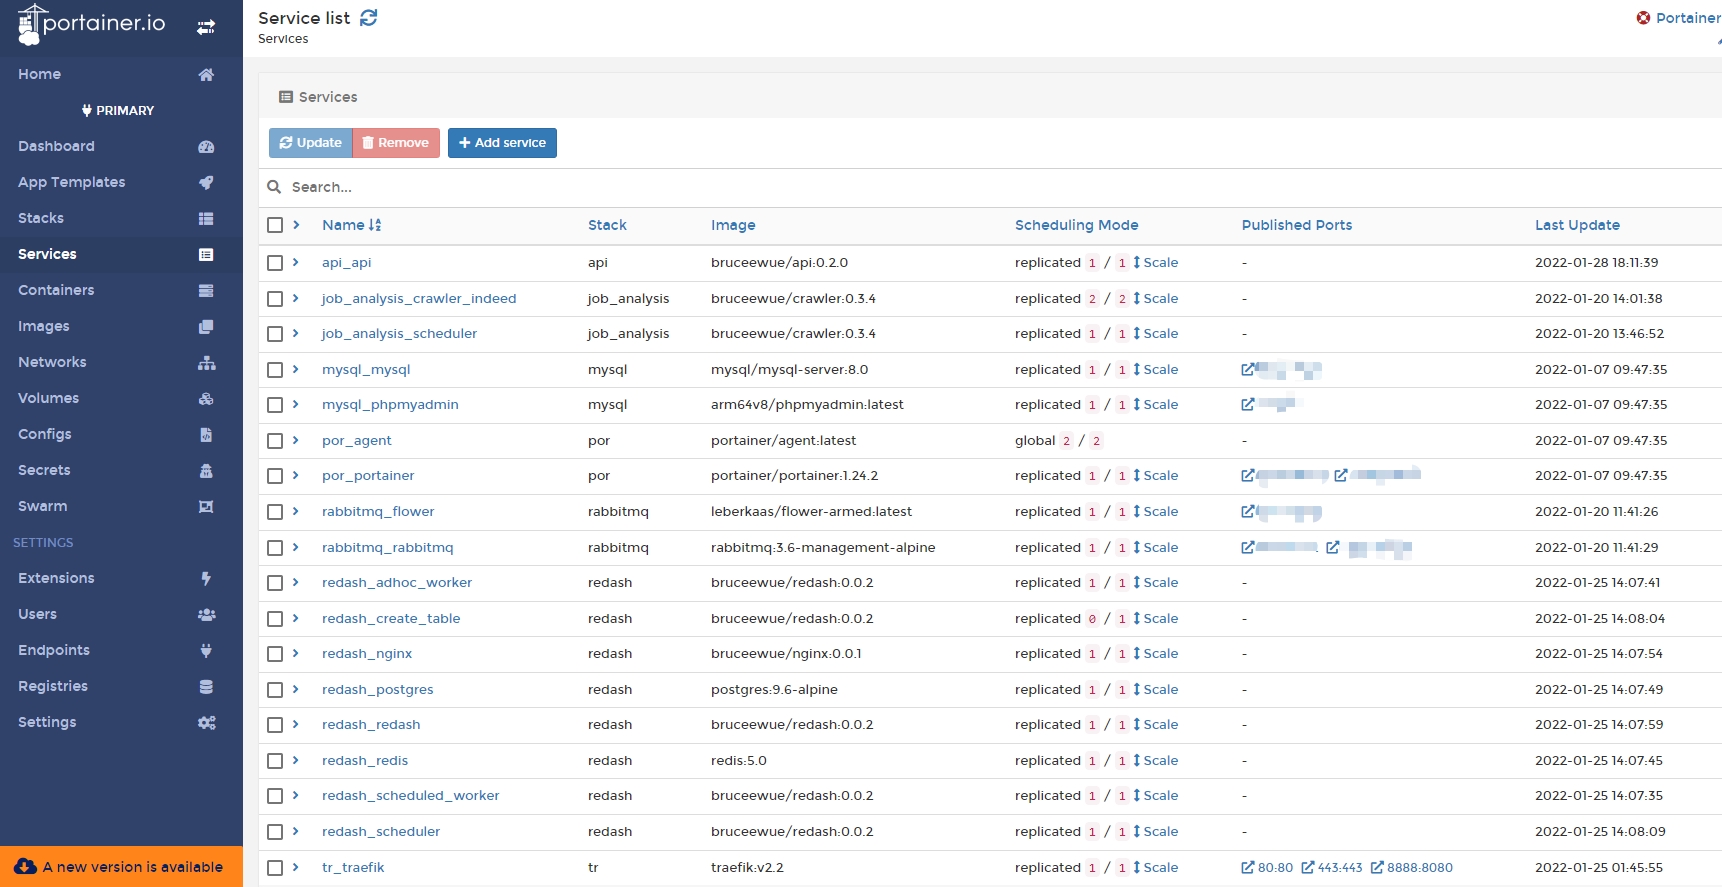
Since this application requires launching many services (API, scraper, rabbitmq, mysql, redash, etc.), a tool is needed to manage them uniformly. In this case, Docker Swarm is used to manage multiple services as a single virtual system, simplifying the process of deploying and managing complex applications. Docker Swarm allows you to easily scale your applications up or down by adding or removing Docker engines from the cluster, and it provides built-in load balancing and enhanced security features. (We can also use Kubernetes (K8s) to manage multiple services as a single system.)
Through the concept of Manager and Worker, multiple machines can be managed, and the Manager can be used to manage all services centrally, including updating services, deploying services, viewing logs, etc., making it very convenient; it is also paired with the portainer UI for management and monitoring.
As we can see in the picture below, there are two machines (nodes) in the cluster
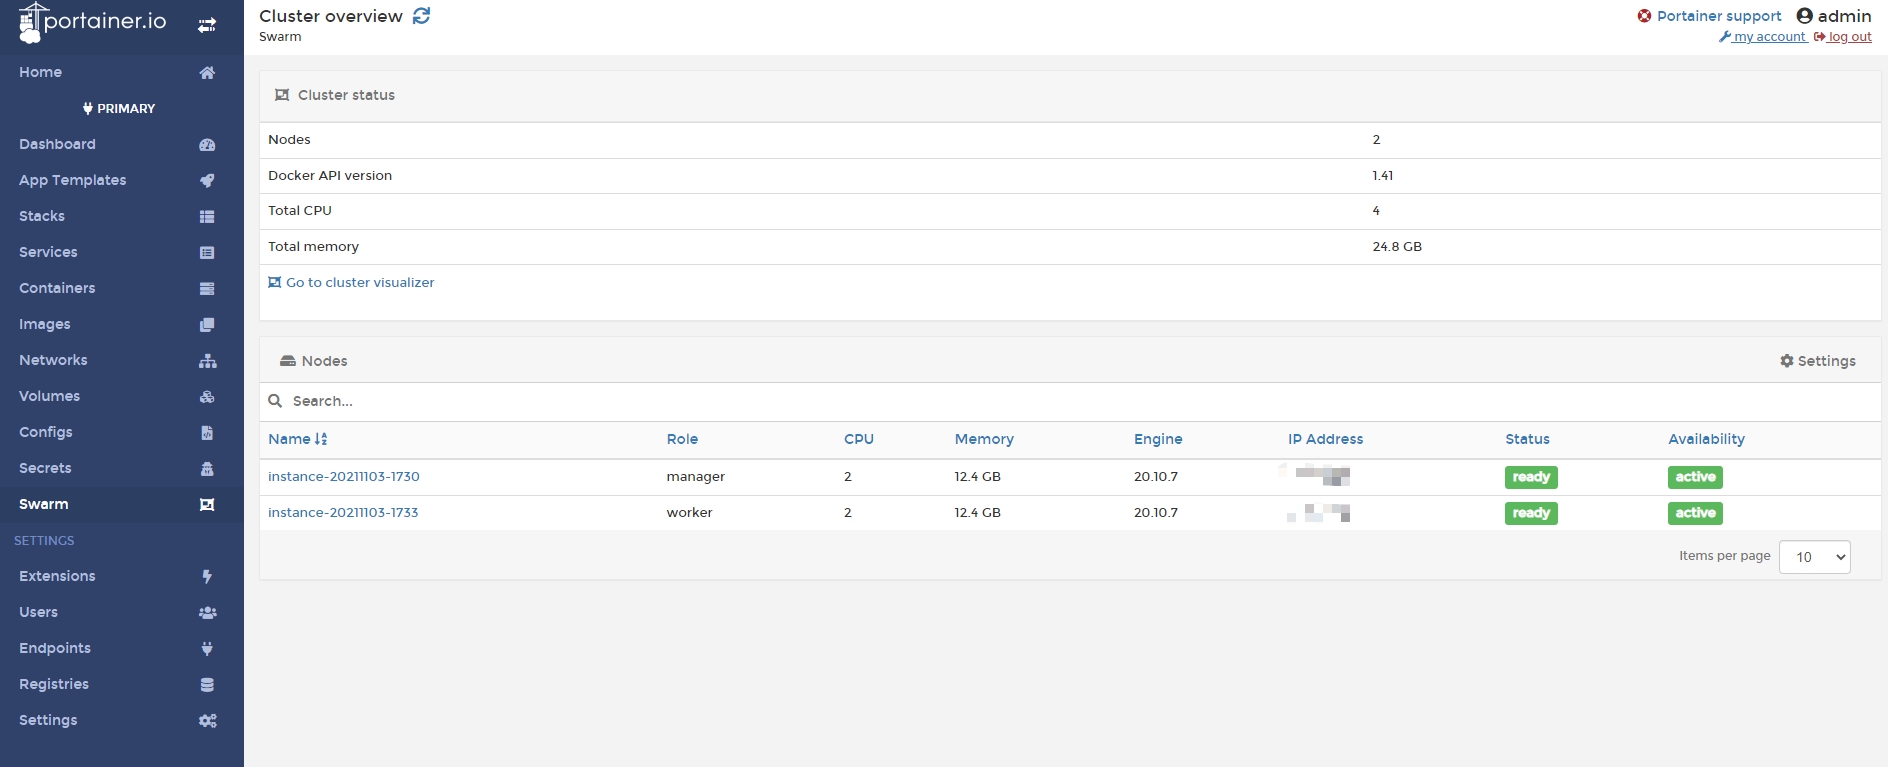
Manage all services from a single interface.
DDNS & SSL
To ensure your API is publicly accessible, assigning a URL is essential. Commonly, this involves purchasing a domain name from registrars like domcomp, where you can explore availability and pricing.
For a cost-effective alternative, consider using a free Dynamic DNS (DDNS) service, such as No-IP. DDNS allows you to establish a domain name that dynamically updates to match your API’s IP address, even as it changes. Bear in mind, regular monthly renewals of the domain name are necessary to maintain its active status.
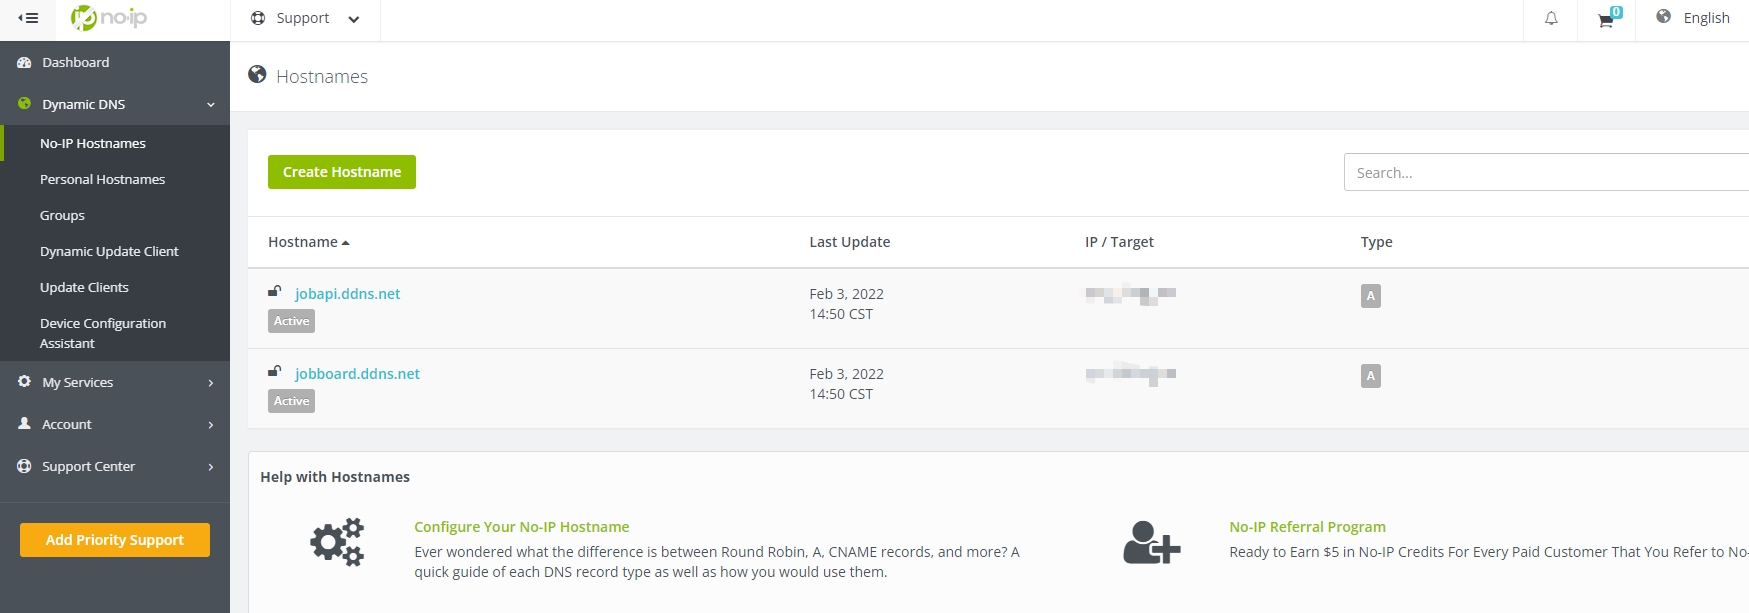
Further securing your API, implementing SSL (Secure Sockets Layer) is crucial. SSL certificates, like the complimentary one from Let’s Encrypt used in this project, establish a secure connection between browsers and servers. Upon successful installation, a browser displays an HTTPS symbol next to your URL, signifying a secure connection.
The management of SSL certificates, URL, DNS, load balancing, and their automatic renewal is streamlined through Traefik, a tool adept in reverse proxying and Docker integration.
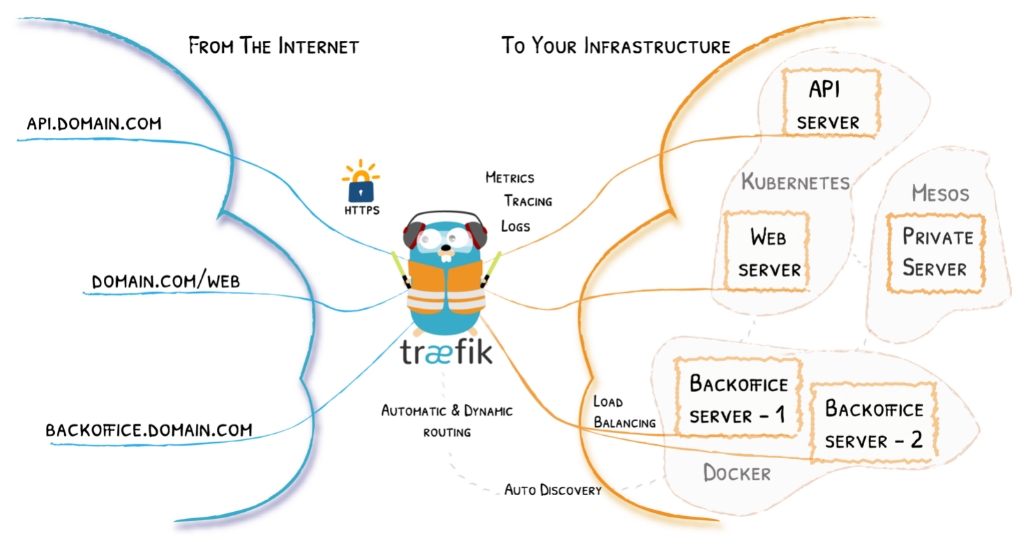
Source: Traefik
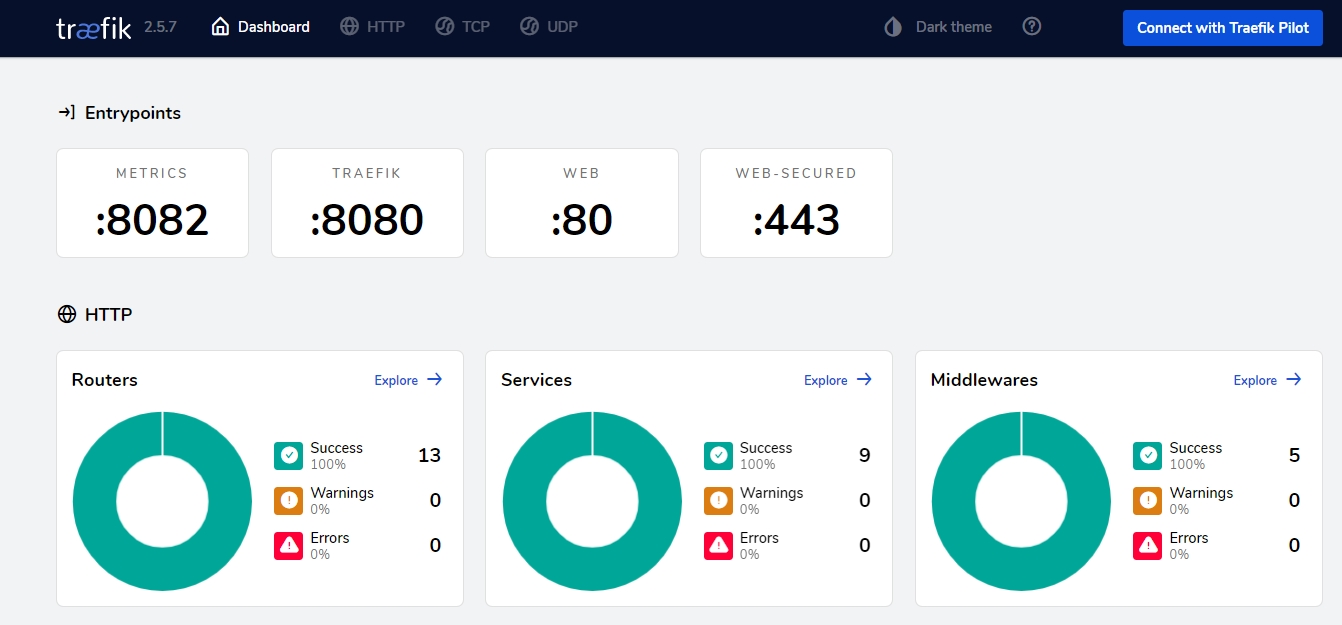
Below is the Traefik v2 dashboard, showcasing its management capabilities.
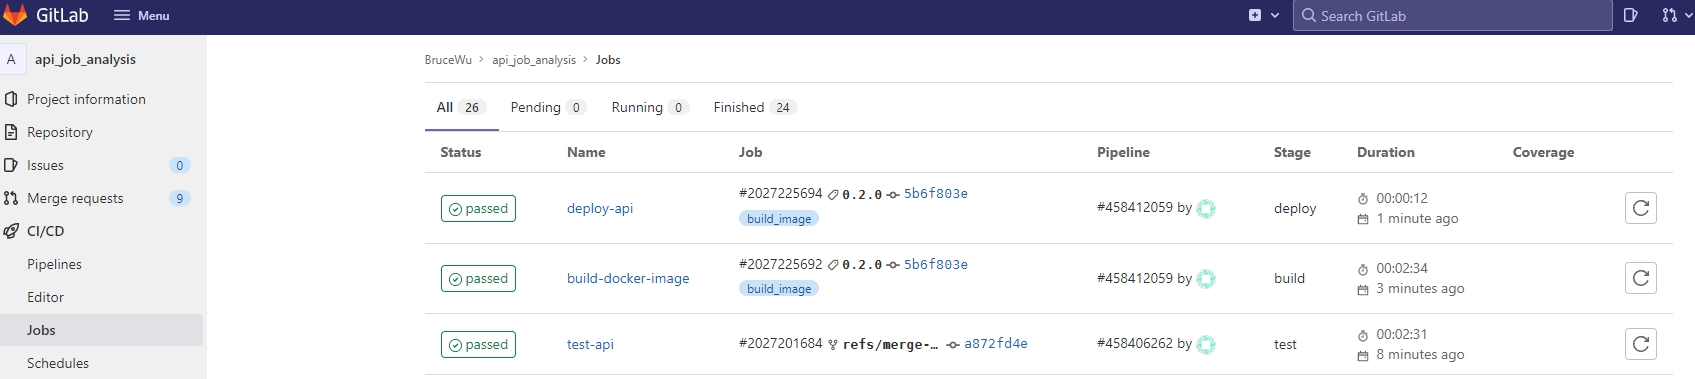
CI/CD
The integration of CI/CD (Continuous Integration/Continuous Deployment) tools is a pivotal element in modern project development. These tools automate the testing and deployment processes, substantially mitigating error risks. In this project, we’ve harnessed the capabilities of GitLab CI/CD. The Specific runners in GitLab are configured to execute CI/CD commands efficiently.
The CI/CD pipeline is triggered by a merge request in our setup. Once initiated, the CI process commences, encompassing automated testing, Docker image construction, and subsequent upload to Docker Hub. The deployment phase (CD) is activated upon the creation of a new tag, facilitating the service deployment to Docker Swarm.
Tools akin to GitLab CI/CD, like CircleCI and GitHub Actions, offer similar functionalities. However, GitLab’s distinct advantage lies in its open-source nature, allowing free on-premises deployment.
The API repository demonstrates a typical CI/CD flow: test -> build -> deploy.
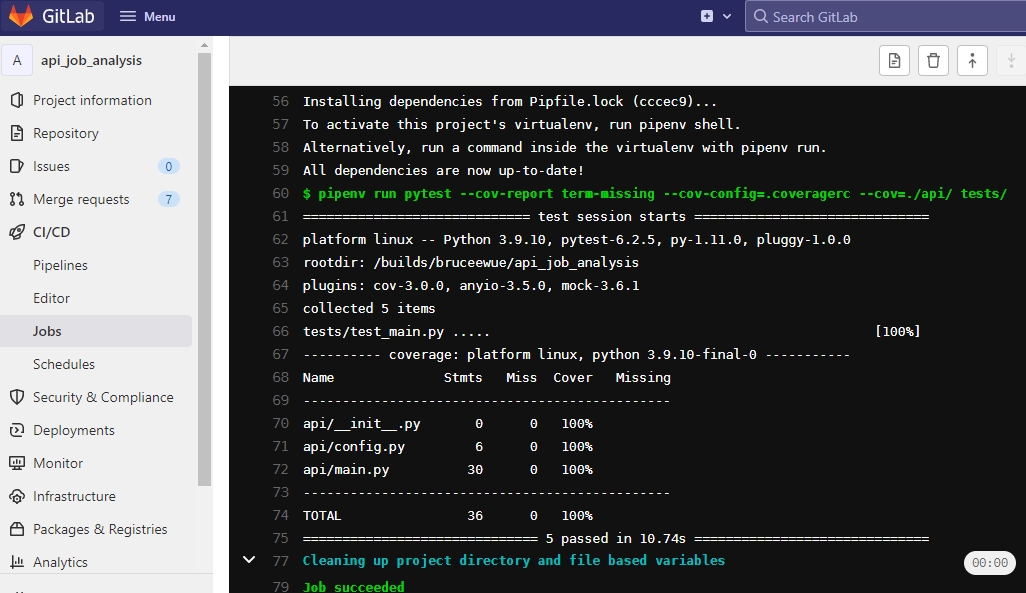
An integral metric in CI processes is test coverage, denoting the proportion of the codebase that undergoes testing. This is crucial for ensuring code reliability and robustness.
Monitoring
Post-deployment, monitoring becomes critical to ensure that each service operates as intended and the performance of the infrastructure aligns with expectations. For this purpose, Prometheus stands out as a robust tool for collecting time-series data. It seamlessly integrates with Traefik and Node-Exporter, facilitating comprehensive data gathering.
The collated data is then elegantly visualized using a Grafana dashboard. This visual representation aids in understanding and analyzing the performance metrics and operational status of the services and the underlying machines.
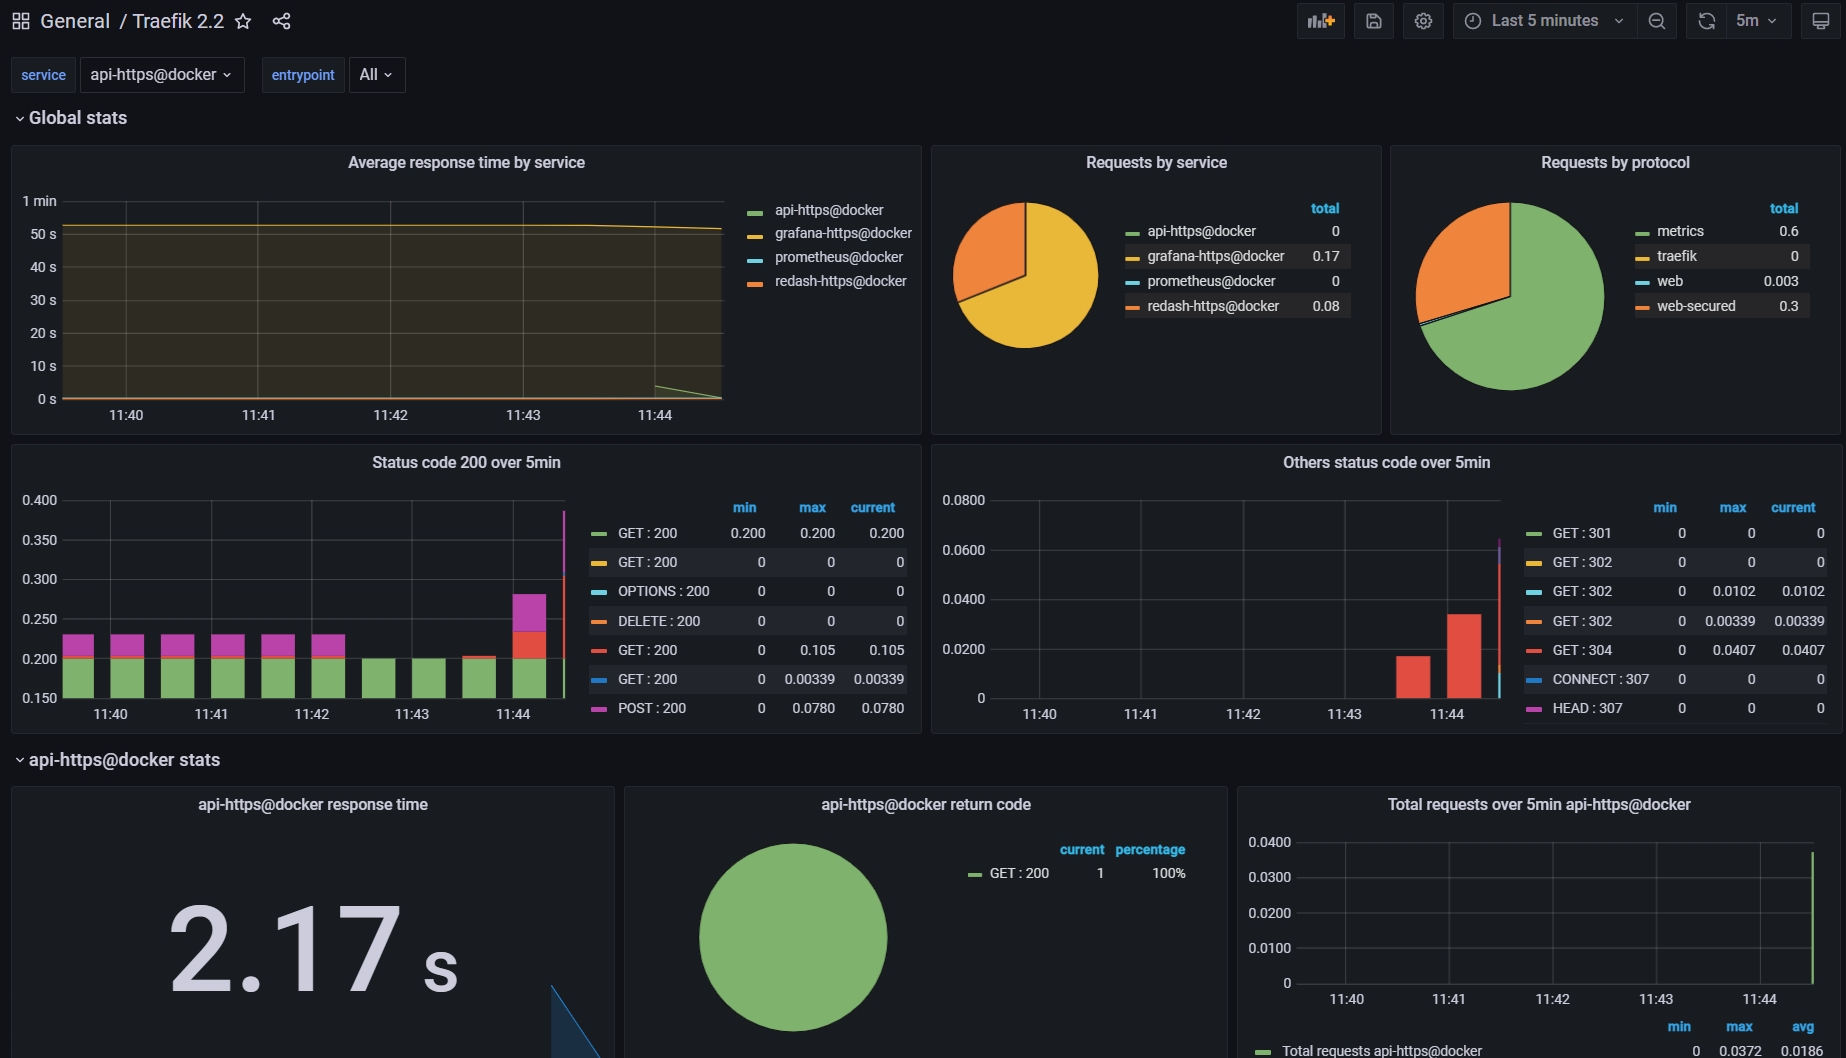 Source: Traefik2.2 Dashboard on Grafana
In our current setup, we are utilizing two machines, hence the node count is displayed as 2. This number provides a quick insight into the scale of our infrastructure being monitored.
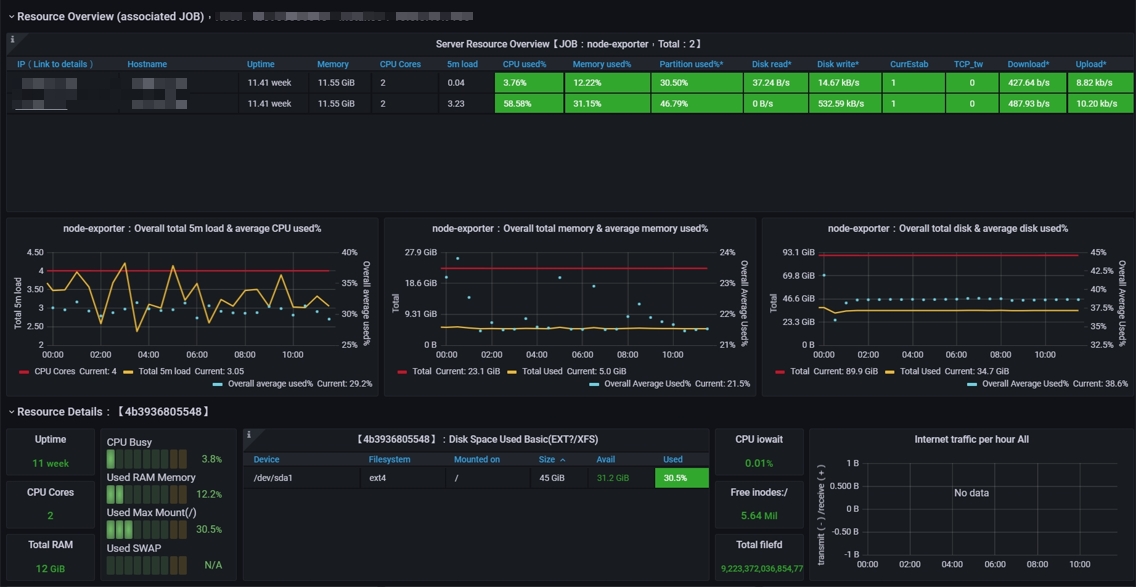 Source: Node Exporter for Prometheus Dashboard EN on Grafana
Result
-
Data API https://bit.ly/3gGBTUX
-
Dashboard Insightful analysis of daily job postings, average salaries, and job description word clouds.