Project - Job Scraping and Analysis

Since I’d like to know the situation of local data-related vacancies in London, England, I have built a job vacancy analysis system, including a distributed crawler with automatic scheduling, a job vacancy analysis dashboard, and a data API. The results are shown at the end of this post.
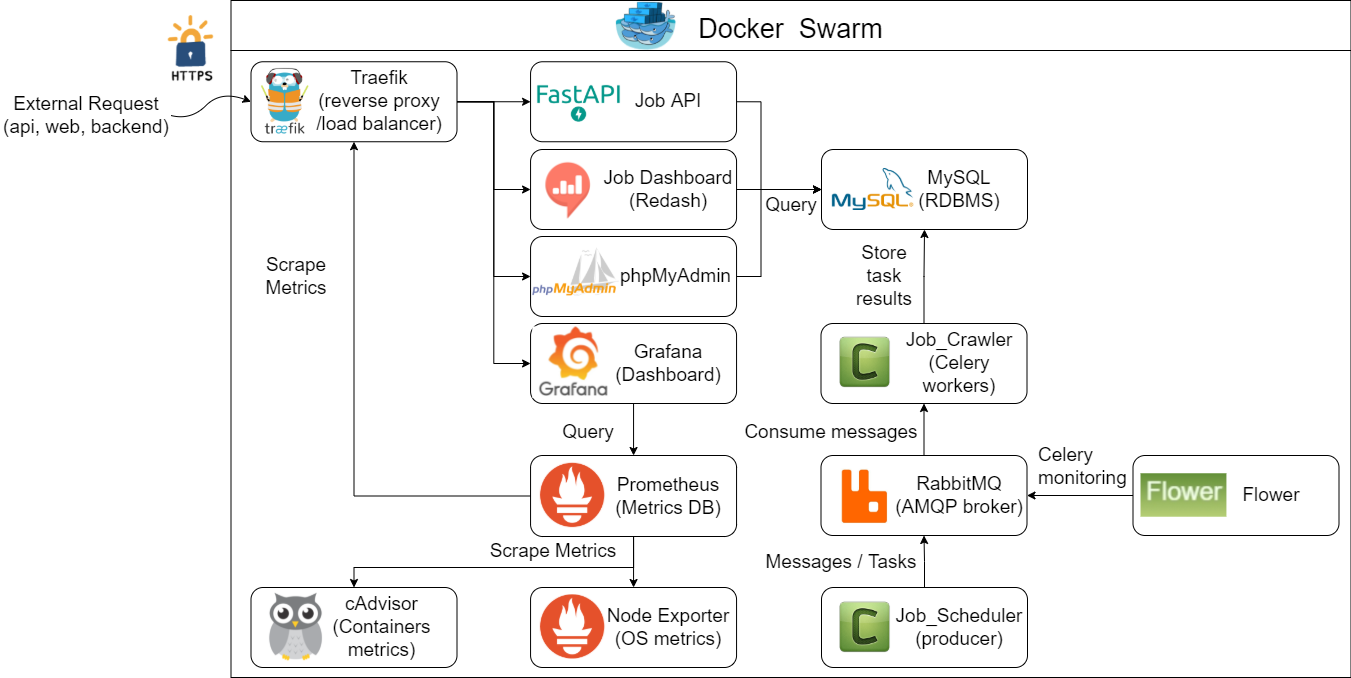
Project Diagram
Environment
Development: Ubuntu 20.04(WSL2) + python 3.9
Deployment: VM(2 OCPUs(ARM64), 12GB RAM) x 2 in Oracle Cloud
Data source

Indeed job search:
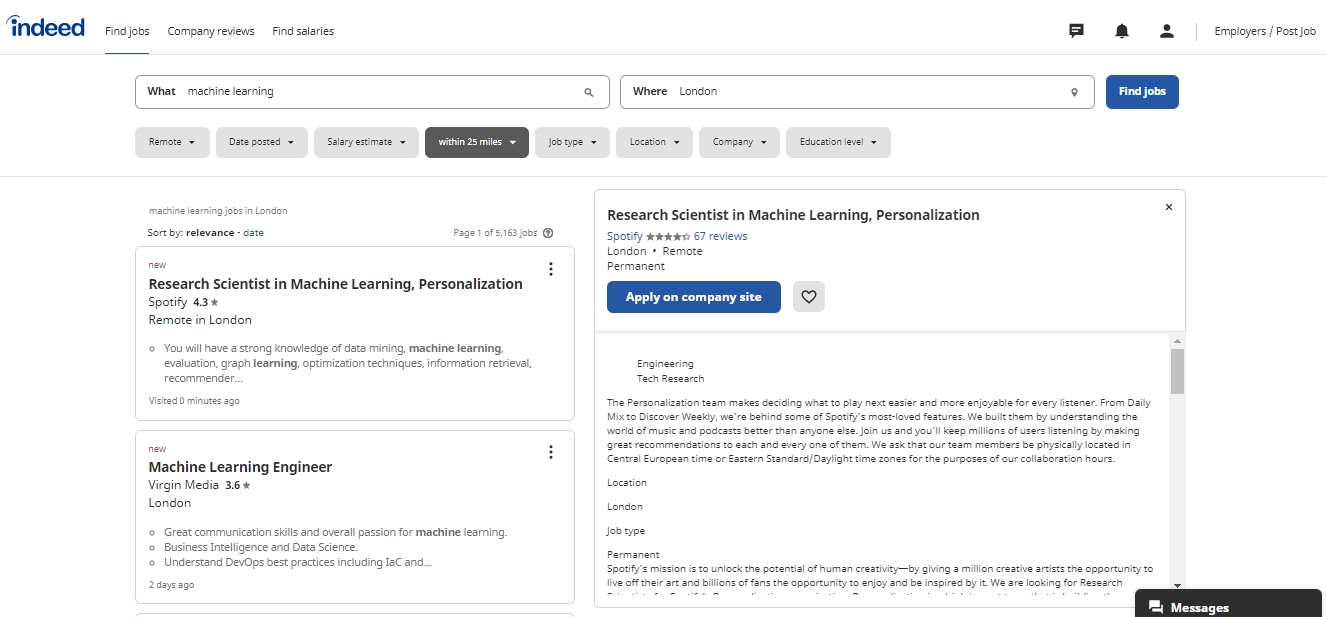
Source: Indeed
Currently, I choose the UK’s largest job search platform, “Indeed” as the data source. Only data science-related and full-time positions in the London area are crawled to avoid burdening the server. Only recent data is collected, new posts added daily are automatically crawled in the daily schedule, and have the flexibility to add other platforms or other types of vacancies in the future.
Why distributed?
- Increase the efficiency of the crawler.
- When the number of crawlers increases, a single computer may be unable to handle it, and if the machine suddenly fails, the crawler will be interrupted.
- Avoid IP blocking due to excessive crawling (used with sleep in the program).
Celery/RabbitMQ/Flower
Celery is a simple, flexible, and reliable distributed system to process vast amounts of messages while providing operations with the tools required to maintain such a system.
It’s a task queue focusing on real-time processing and supporting task scheduling.
There are three roles in a distributed crawling architecture:
- Producer, which dispatches tasks to the Broker
- Message Broker, which receives tasks and forwards them to Workers (in this post, I use RabbitMQ as the distributed task forwarding/message delivery center)
- Worker, which receives tasks from the Broker and executes them (e.g., Crawler)
Process: the producer sends a task to the queue. After the workers (the units that execute tasks provided by Celery) connect to the broker, they can receive tasks from the queue and process them based on the settings.
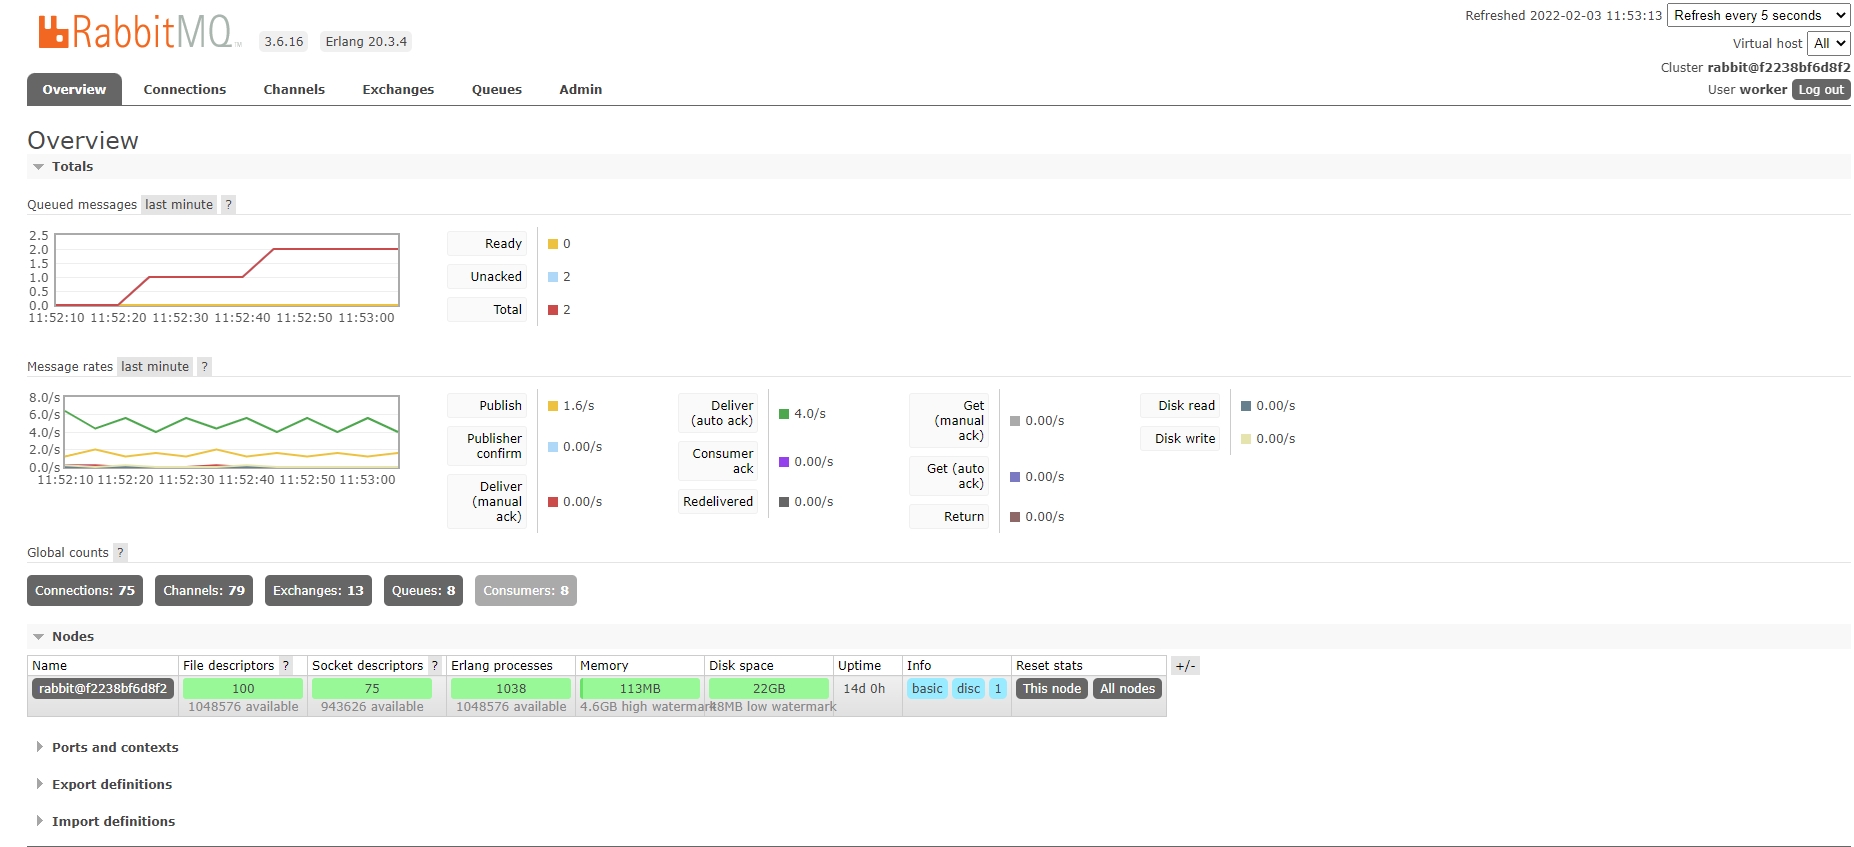
The following figure shows the RabbitMQ overview. We can see that two tasks are waiting for workers in the queue. The page ‘queue’ also provides information about each queue’s status and the tasks’ details.
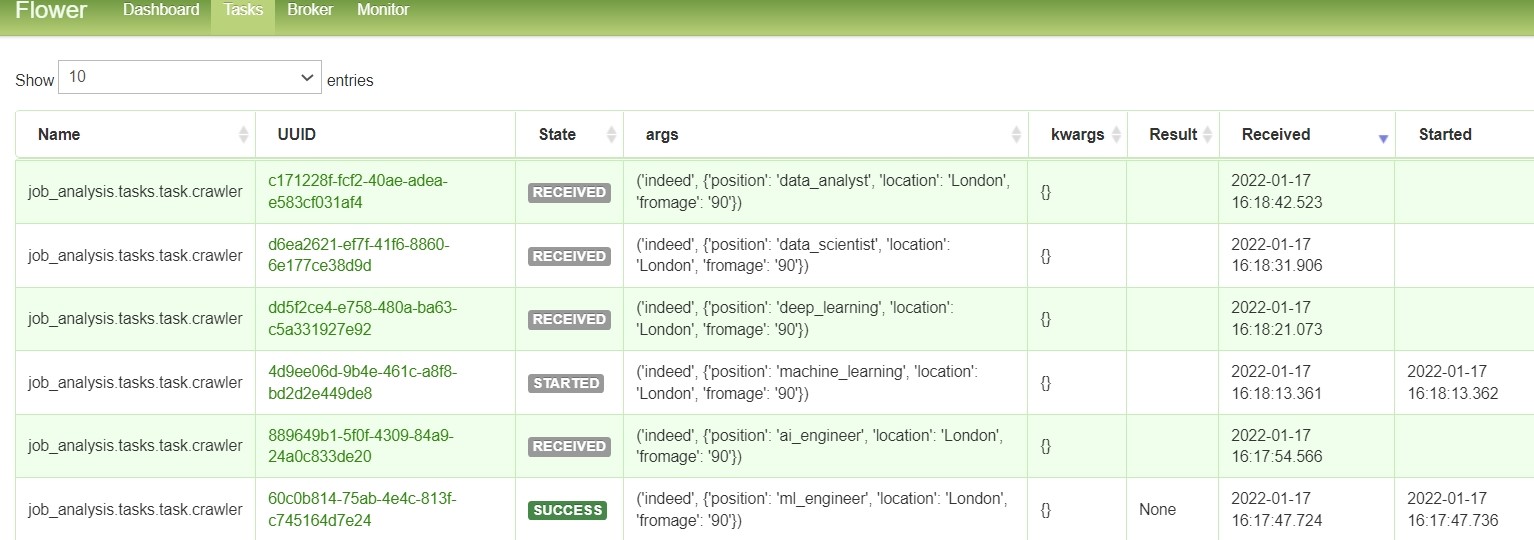
We can monitor the status of the workers through Flower to see if it is on and the status of the task execution. Currently, only two workers are enabled for this project, which can be increased or decreased according to the needs.
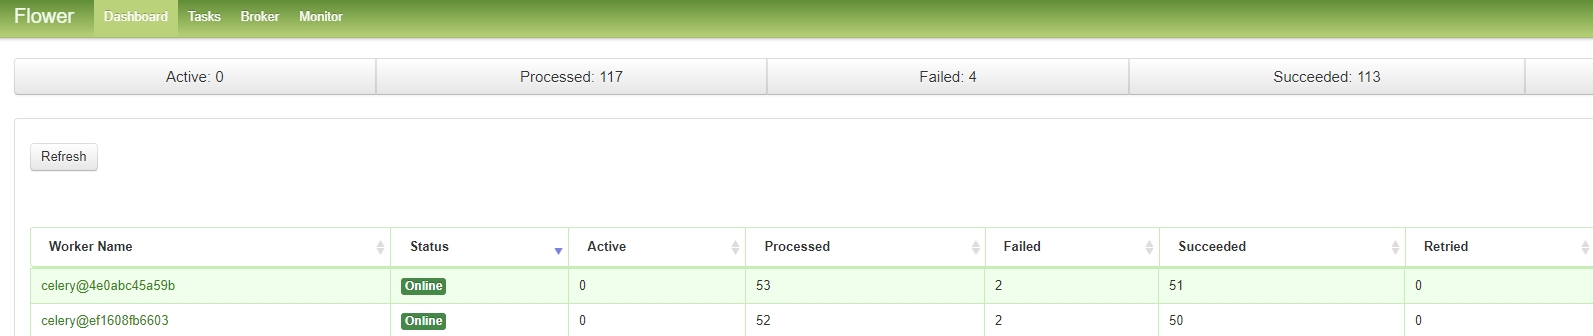
The list of tasks executed by the workers.
Scheduling
Because we need to automatically crawl the new job vacancies of the day, the python package APScheduler is used here to execute tasks. The following code snippet is to set a timer and execute the function ‘sent_crawler_task_DE’ every day at 12:00 Taipei time from Monday to Sunday
    scheduler = BackgroundScheduler(timezone="Asia/Taipei")
    scheduler.add_job(
        id="sent_crawler_task_DE",
        func=sent_crawler_task_DE,
        trigger="cron",
        hour="12",
        minute="0",
        day_of_week="*",
    )
API & Load test
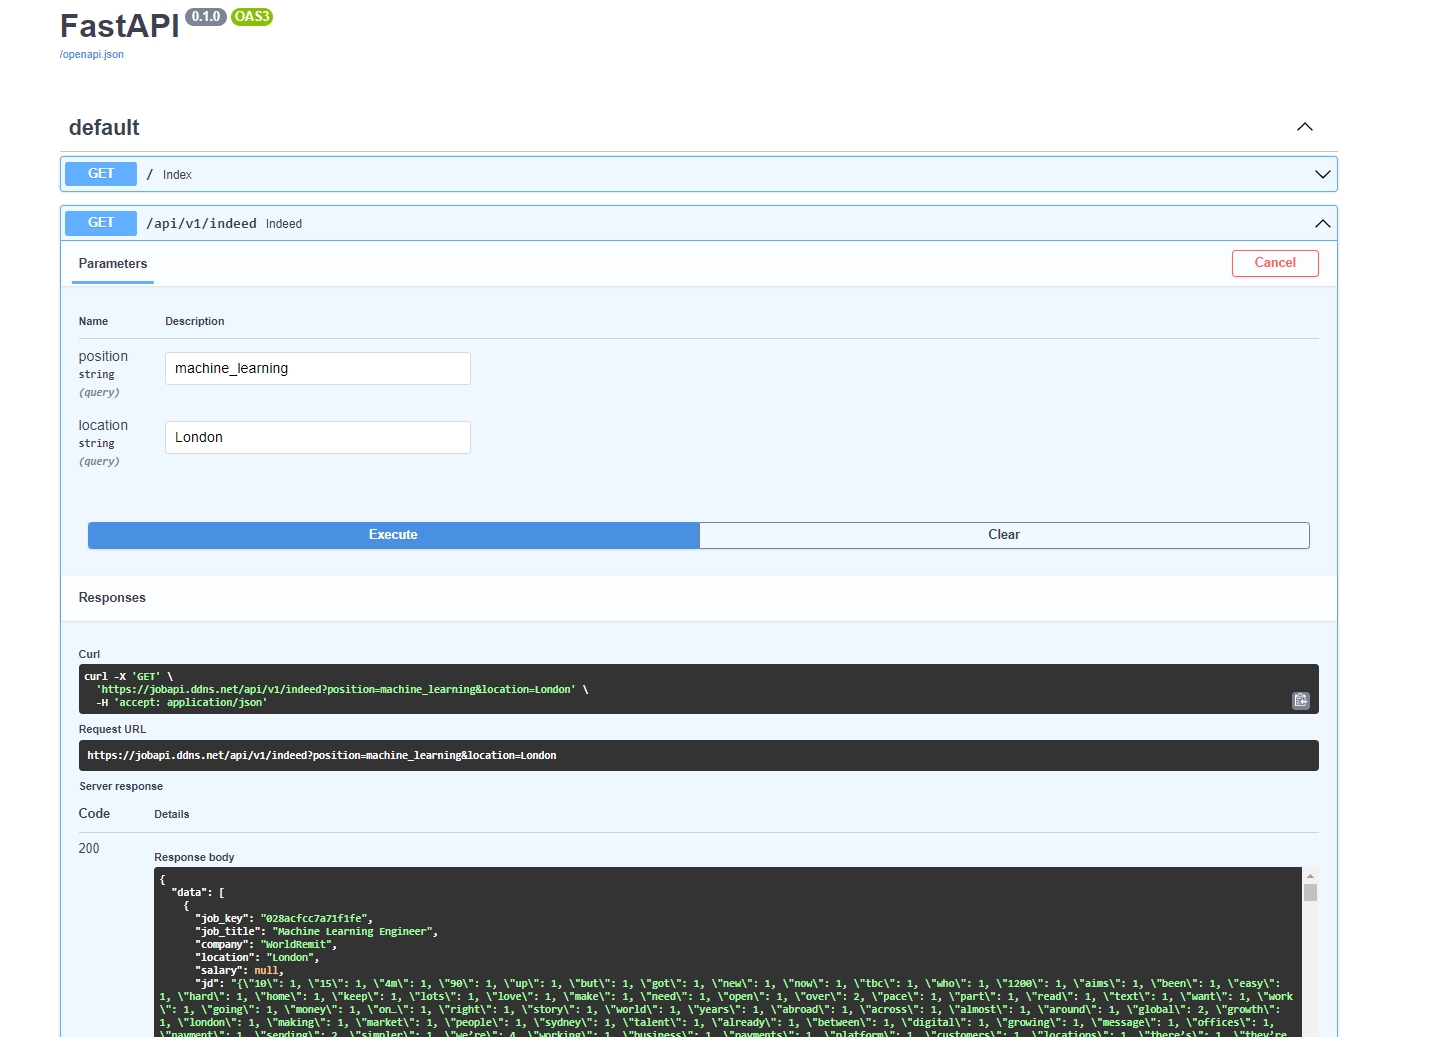
FastAPI can be used to create RESTful APIs and automatically generate the OpenAPI file (OAS3), allowing us to test the APIs on the web.
After inputting the position and location parameters, the API will return job vacancy data in JSON format.
Next, we can try performing load testing on the created API. The ApacheBench (ab) python package can be used for this purpose. It simulates multiple users sending multiple requests to the server simultaneously.
The following command can be used to perform load testing on the API service deployed on the local machine (concurrency=10, requests=1000):
apt-get install apache2-utils -y
ab -c 10 -n 1000 'http://127.0.0.1:8888/'
Here is an example of the output:
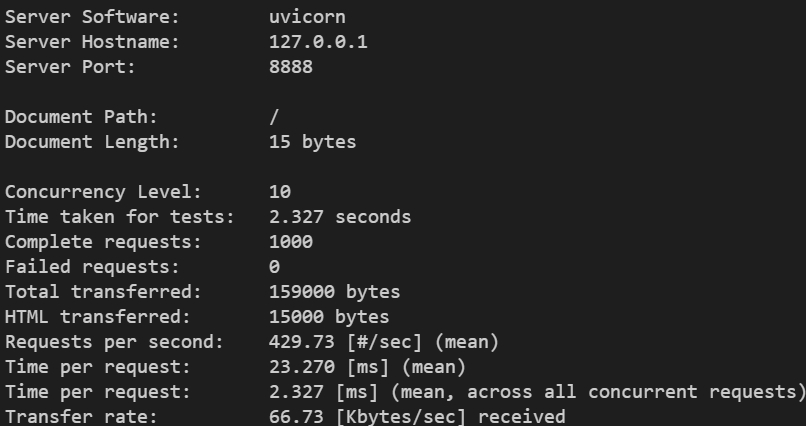
Equest per second: the number of requests that the API can handle per second.
Time per request: the average time spent on each request (in milliseconds).
Failed requests: the number of failed requests. This may be related to the stability of the server.
Dashboard
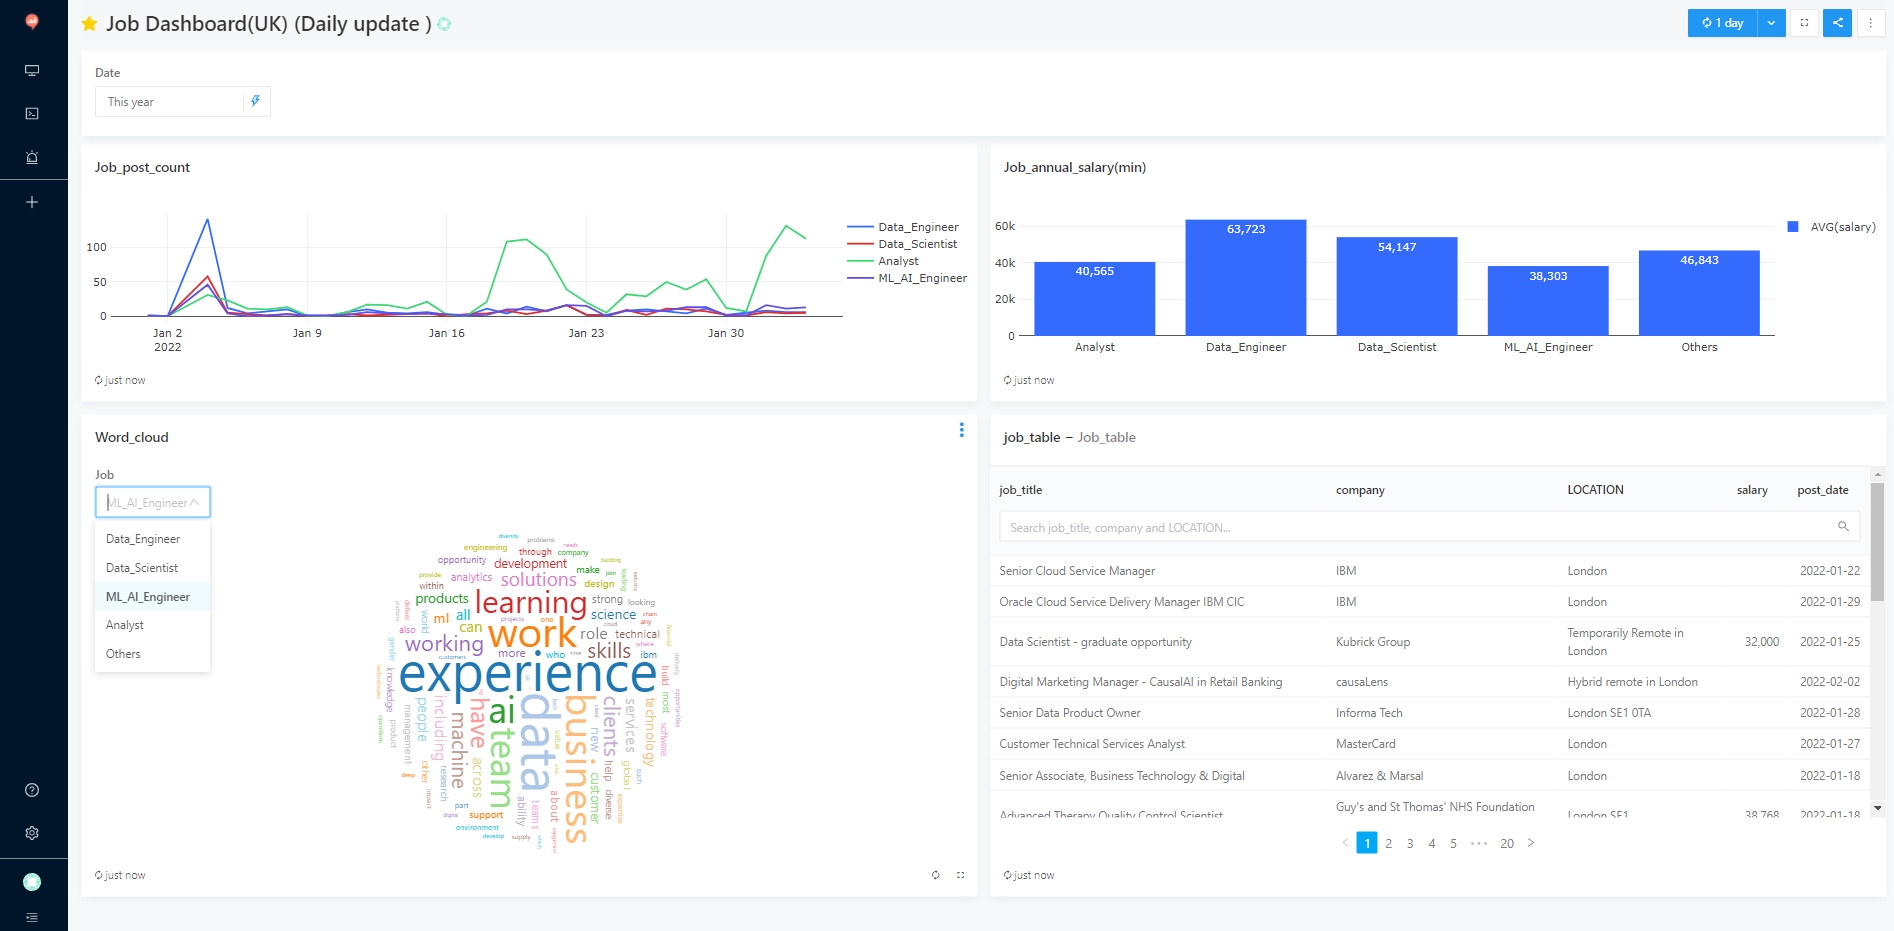
In order to have a clear understanding of job vacancies, a dashboard is produced using Redash, an open-source BI system. The advantage is that it is convenient to retrieve data from the DB through SQL query, and then visualize the results (currently supporting Chart, tunnel, map, pivot table, word cloud, etc.). The results are as follows.
Deployment
Since this application requires launching many services (API, scraper, rabbitmq, mysql, redash, etc.), a tool is needed to manage them uniformly. In this case, Docker Swarm is used to manage multiple services as a single virtual system, simplifying the process of deploying and managing complex applications. Docker Swarm allows you to easily scale your applications up or down by adding or removing Docker engines from the cluster, and it provides built-in load balancing and enhanced security features. (We can also use Kubernetes (K8s) to manage multiple services as a single system.)
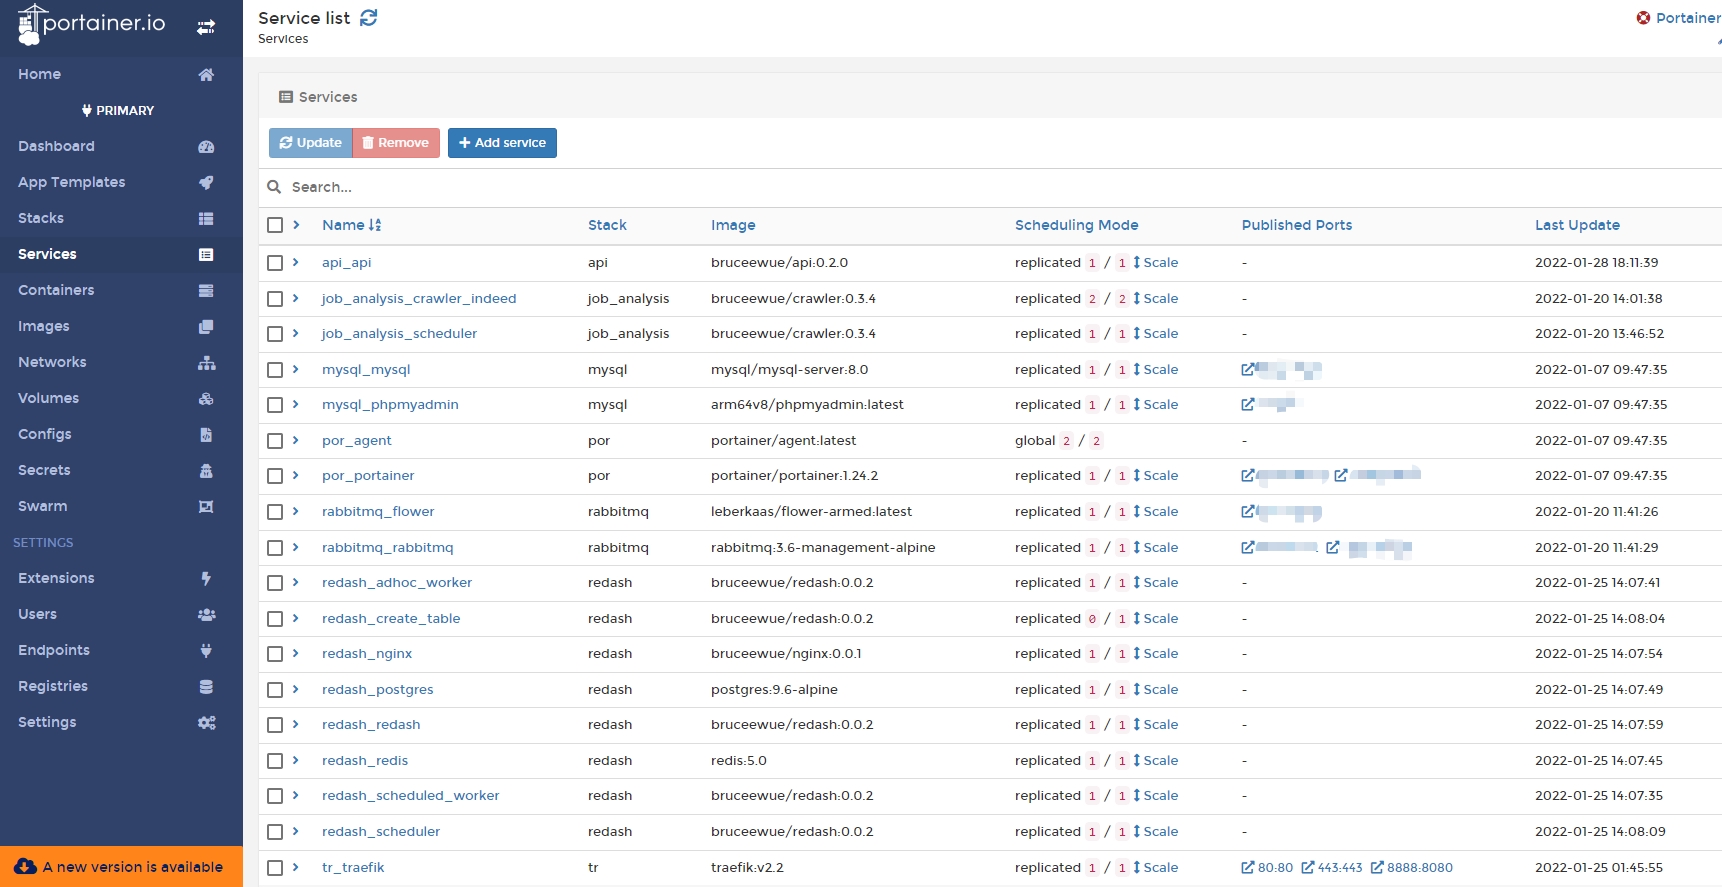
Through the concept of Manager and Worker, multiple machines can be managed, and the Manager can be used to manage all services centrally, including updating services, deploying services, viewing logs, etc., making it very convenient; it is also paired with the portainer UI for management and monitoring.
As we can see in the picture below, there are two machines (nodes) in the cluster
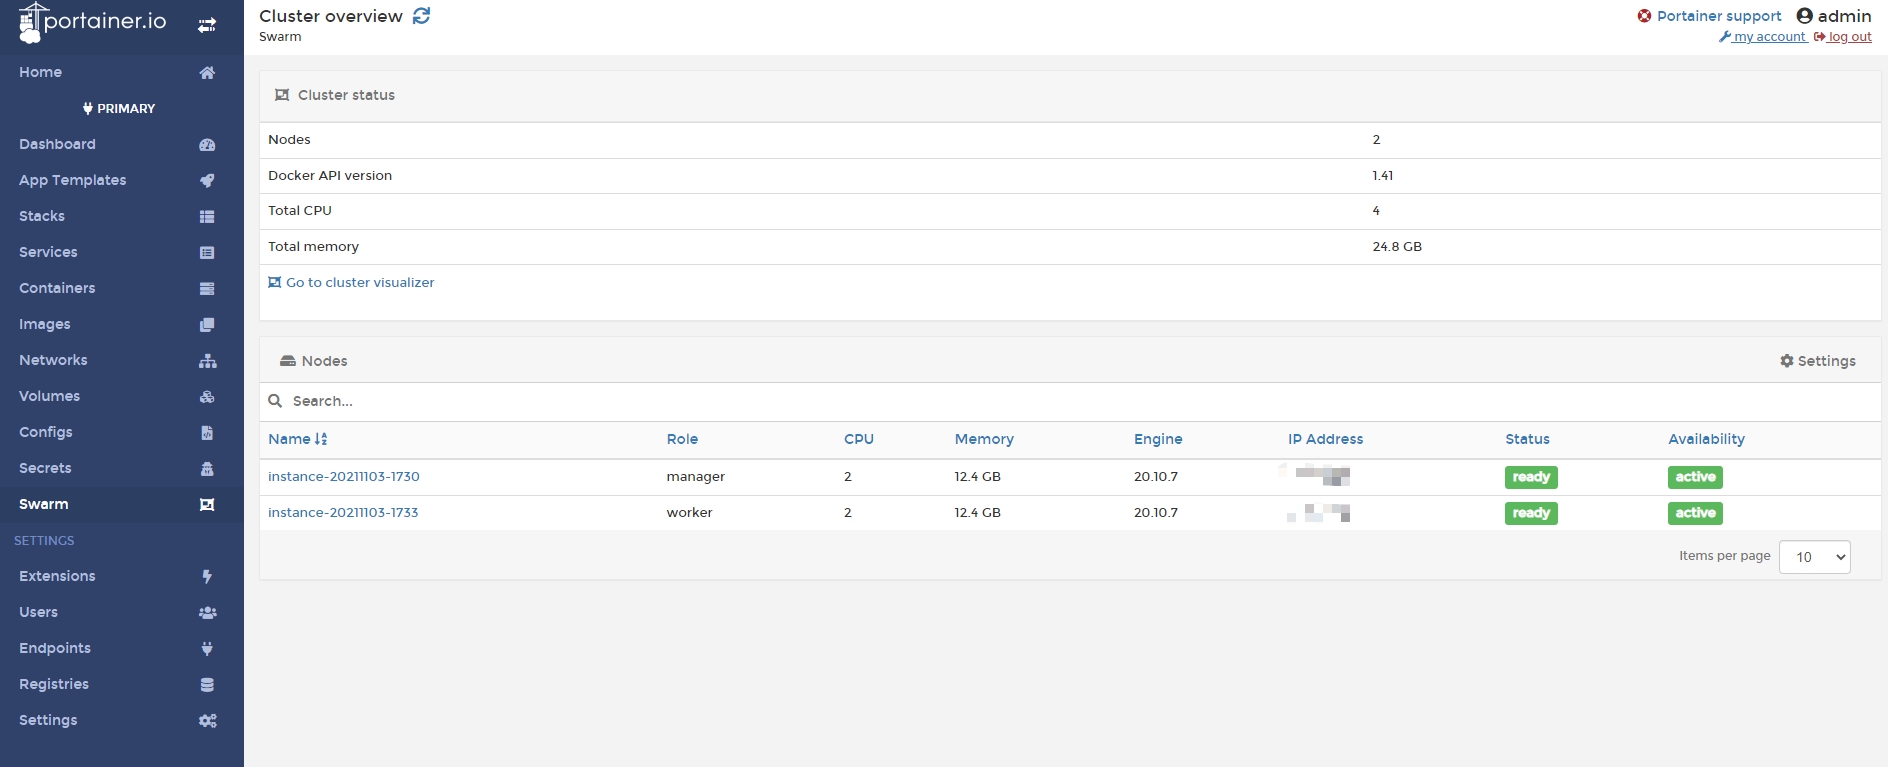
Manage all of our services from a single interface.
DDNS & SSL
In order to make your API available to the public, you will need to provide a URL rather than just an IP address. Typically, domain names are purchased from a domain name registrar and come at a cost. You can check the availability and pricing of a domain name by going to a domain name registrar such as domcomp and searching for the domain you are interested in.
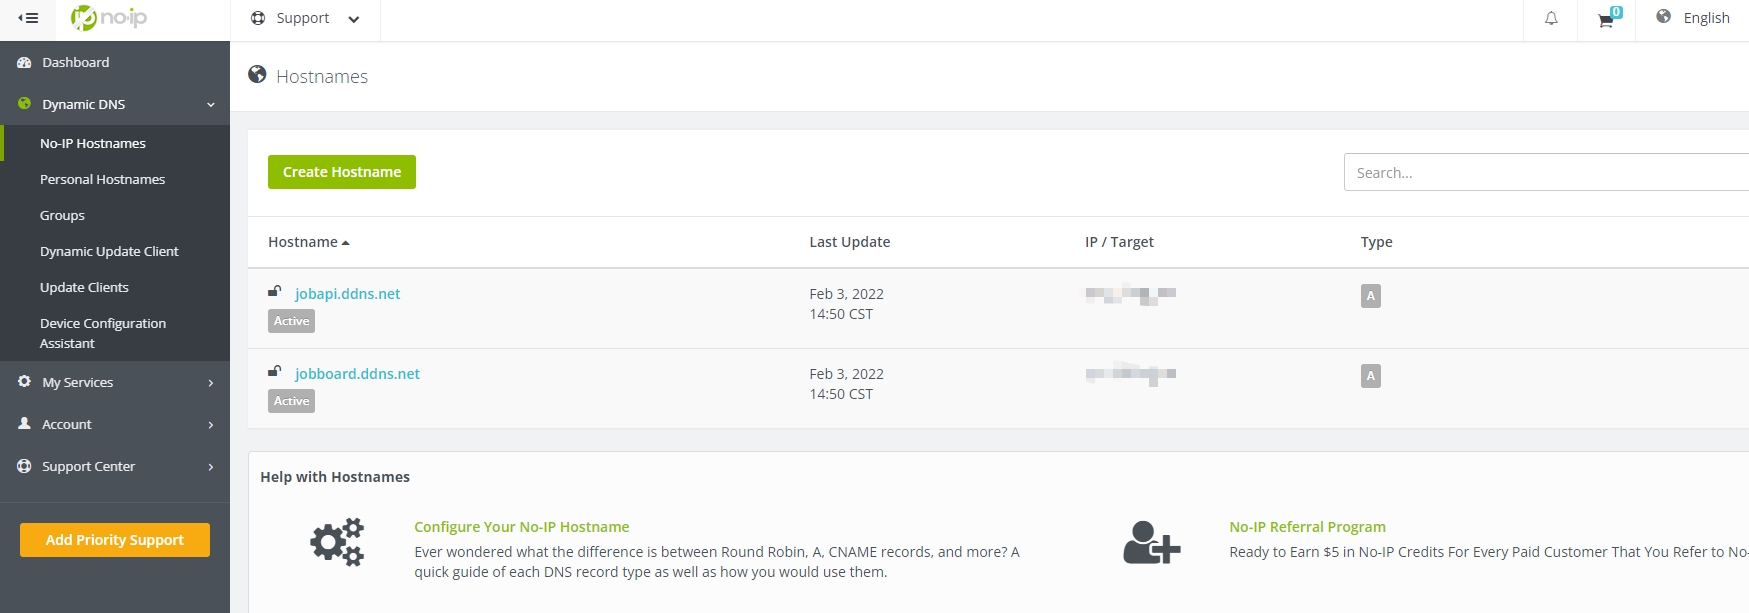
Alternatively, you can use a free dynamic DNS (DDNS) service such as No-IP to provide a URL for your API. With a DDNS service, you can create a domain name that automatically points to your API’s IP address, even if it changes. However, you will need to manually renew the domain name each month to keep it active.
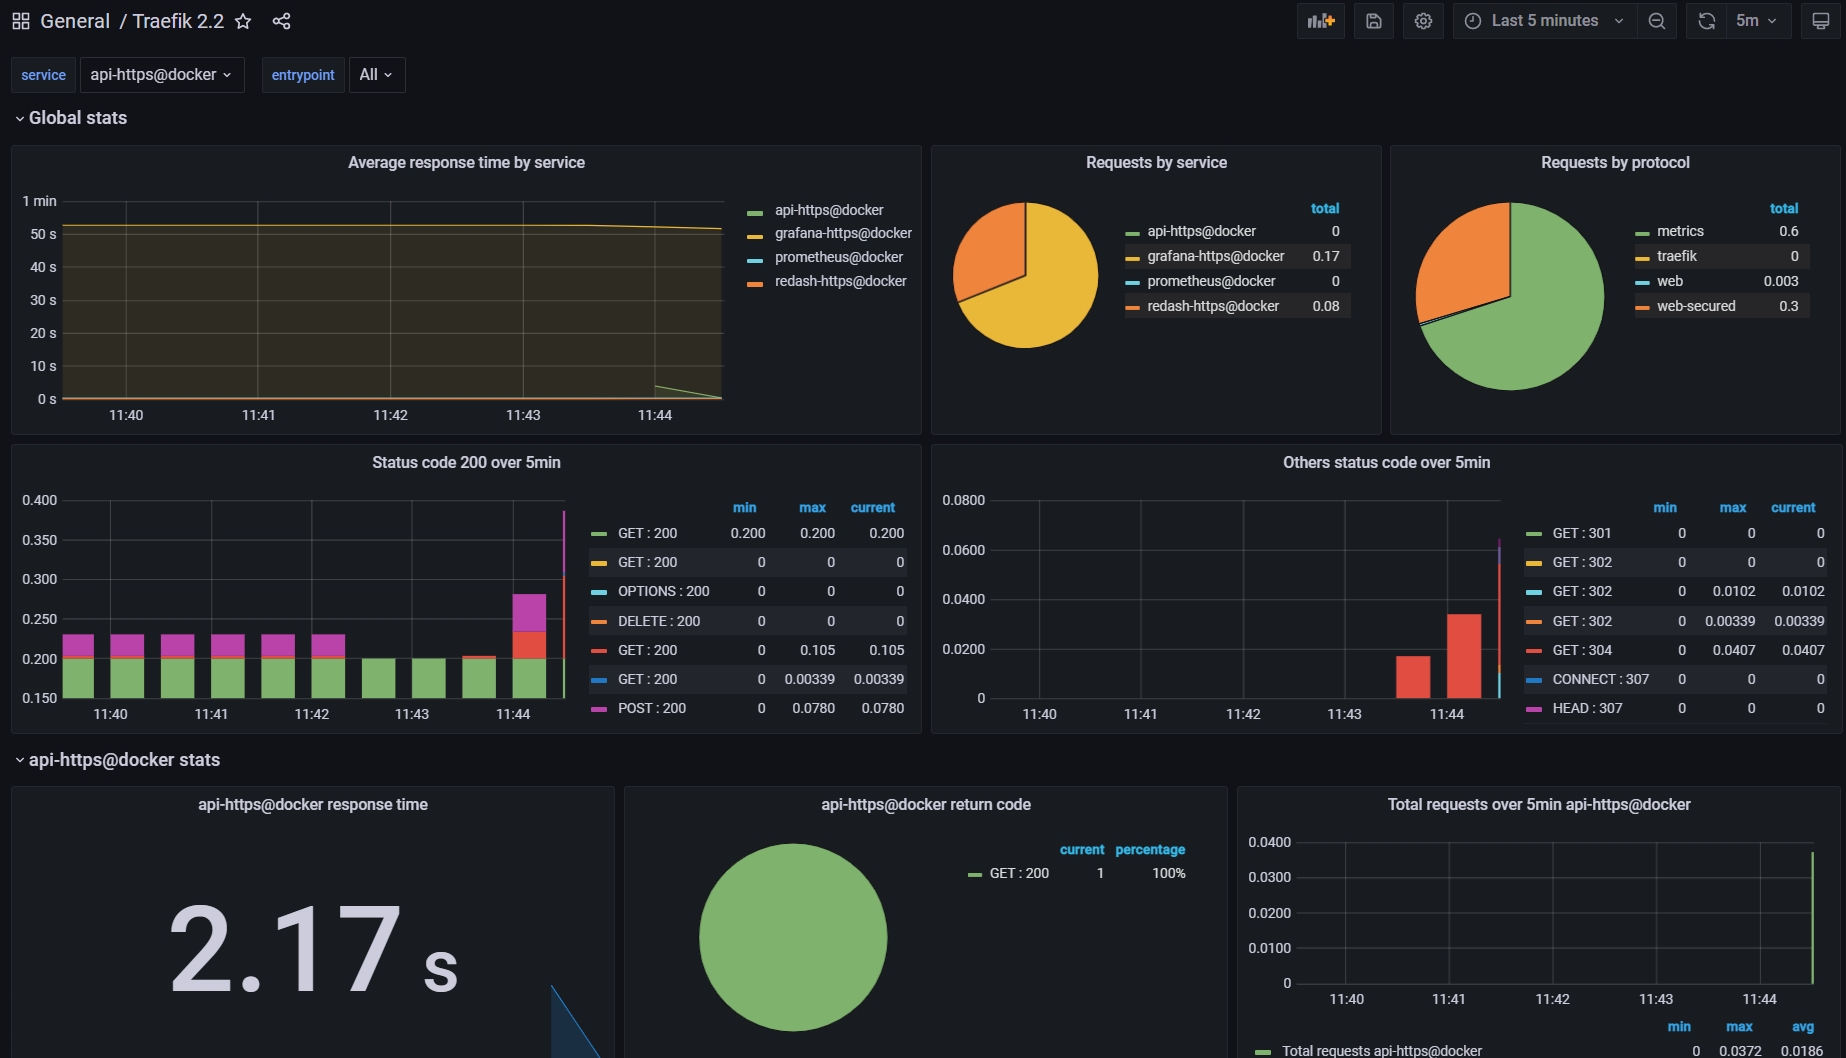
SSL (Secure Sockets Layer) is a security certificate that enables a secure connection between a web browser or computer and a server. After successful installation, an HTTPS symbol will appear next to the URL in the browser. Many organizations issue SSL certificates, and this project uses a free SSL certificate from Let’s Encrypt. The certificate is managed using the tool Traefik, which performs reverse proxy and includes features for managing URLs, DNS, load balancing, and automatically renewing SSL certificates. It is also easy to integrate with Docker.
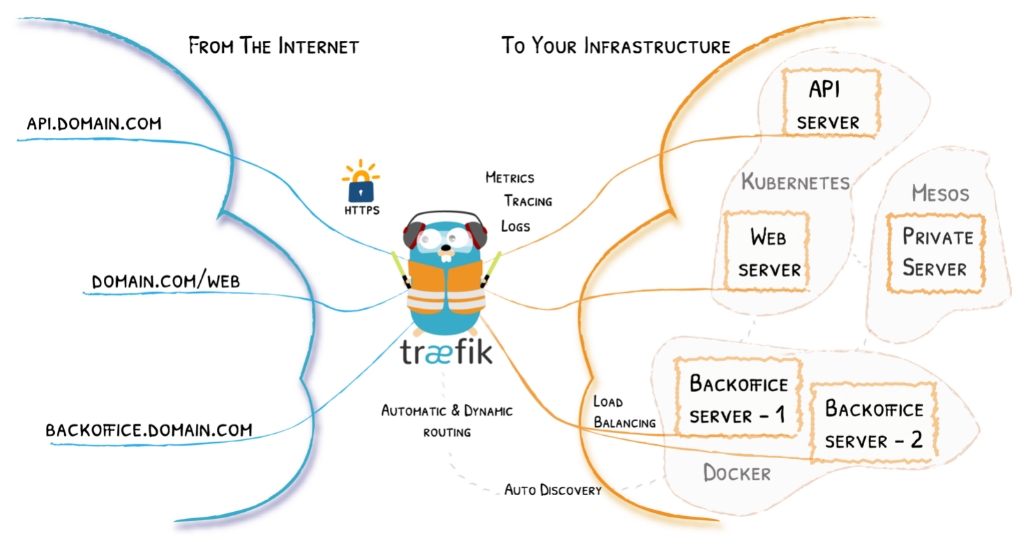
Source:Traefik
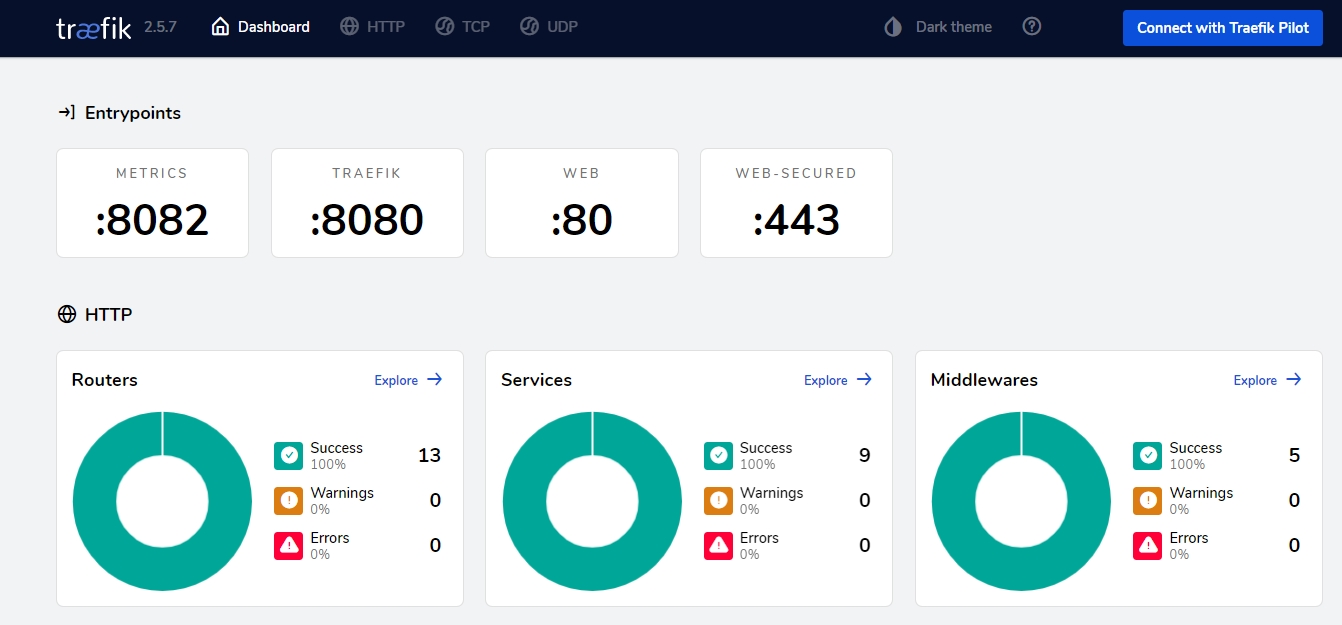
The dashboard for Traefik v2.
CI/CD
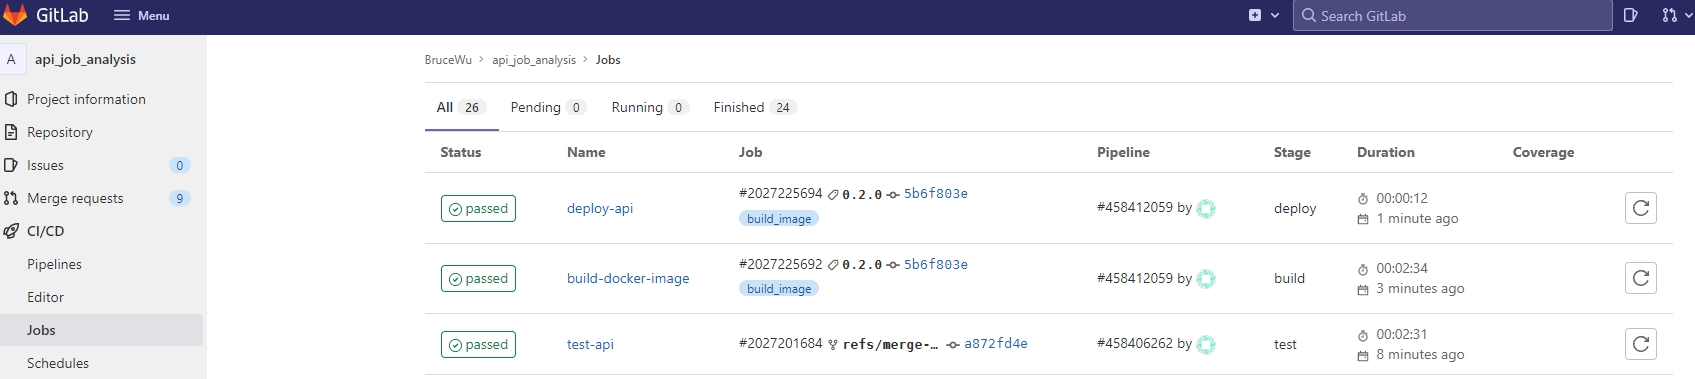
During the development and iteration of the project, a CI/CD (Continuous Integration/Continuous Deployment) tool can be used to automate the testing and deployment process, reducing the chance of errors. This project uses Gitlab CI/CD, and the Specific runners execute CI/CD commands. Currently, the configuration is set to trigger CI only when a merge request is made. The CI process automatically performs testing, builds a docker image, and uploads it to docker hub. After a new tag is created, the CD process is triggered, and the service is deployed to the docker swarm. Similar CICD tools include CircleCI, GitHub Actions, etc. The advantage of Gitlab is that it is open source and can be deployed on your own server (on-premises) for free.
For example, in the API repository, the process would be test -> build -> deploy.
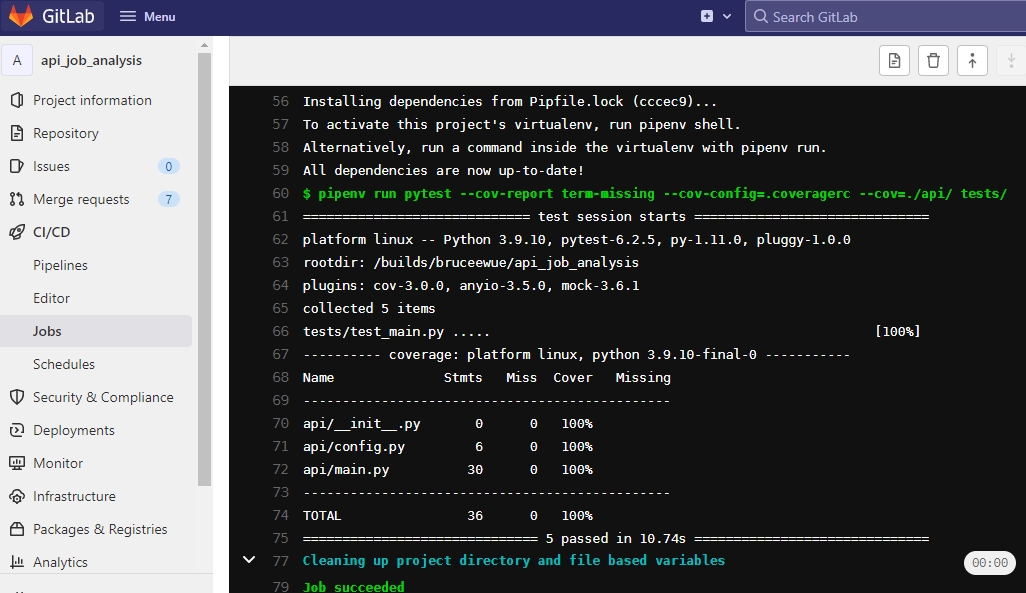
Test coverage refers to the percentage of your codebase that is executed during testing in a CI process.
Monitoring
After deployment, it is important to monitor the service to ensure that the operation status of each service and the performance of the machines are as expected. Prometheus can be used to collect time-series data through integration with traefik and node-exporter, and the results can be visualized in a Grafana dashboard.
 Source:Traefik2.2
In this case, there are two machines being used, so the node count is 2.
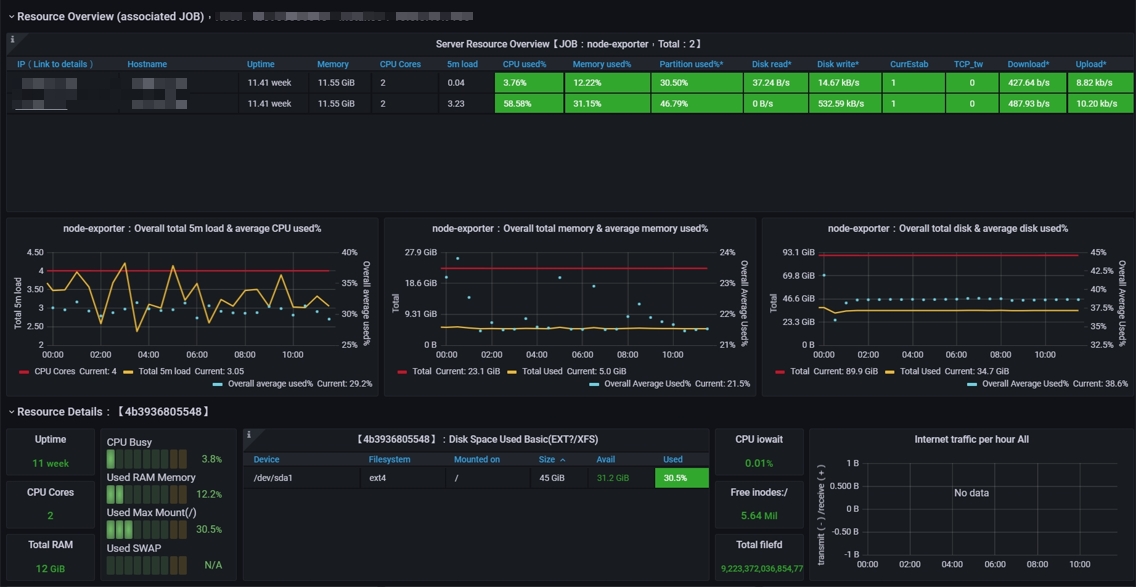 Source:Node Exporter for Prometheus Dashboard EN
Result
- Data API
- Dashboard
The following is an analysis of the number of jobs posted daily for each job type, the average salary of each job type, and the word cloud of the JD in the job postings.
Note: The data up to May 2022 is used as an example case.